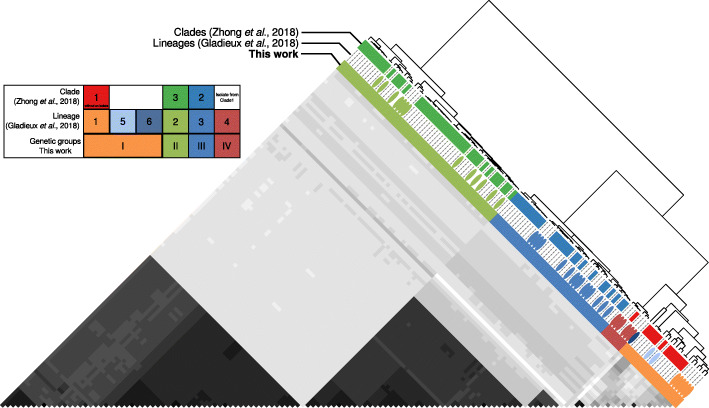
Fig. 1.
Genetic clustering of Magnaporthe oryzae reveals three defined groups and a diverse set of individuals. The pairwise relatedness between M. oryzae samples (X and Y) was estimated using f3-outgroup statistics of the form f3(X, Y; outgroup), which measures the amount of shared genetic history (genetic drift) between X and Y after the divergence from an outgroup (M. oryzae strain from Setaria). The hierarchical clustering is based on f3-scores resulting from f3-outgroup statistic calculations. Darker colors indicate more shared drift

