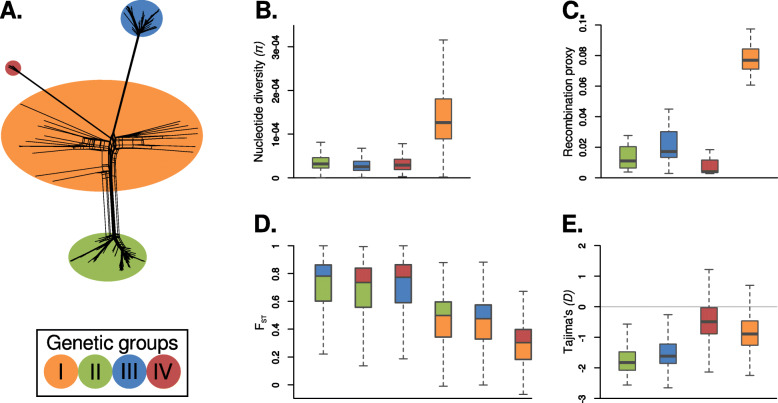
Fig. 3.
Magnaporthe oryzae population structure is driven by recombination and global clonal expansions. a Phylogenetic network showing the three well-defined groups (green, blue, and red) and the diverse set of individuals (orange) from Fig. 1. b Within-population comparisons of nucleotide diversity measured as π. c Recombination proxy calculated by dividing the number of violations of the four-gamete test by the total number of SNPs. d Genetic distances between groups measured as fixation indices (Fst). The box colors depict the pairwise comparisons between groups. e Tajima’s D

