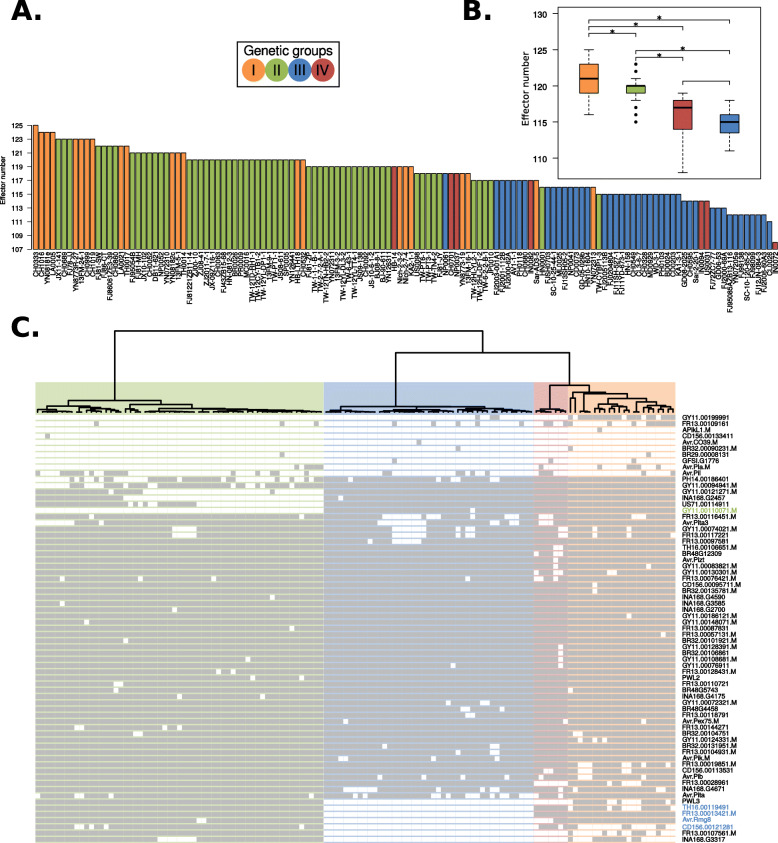
Fig. 6.
Rice blast genetic lineages vary in the number and patterns of presence and absence of candidate effector genes. a Clonal lineages carry a reduced repertoire of effector genes compared with the diverse group I. b The box-and-whisker plots show the distribution of effector number per isolate for each genetic group. Asterisks represent a p value < 0.01 for a one-tailed Wilcoxon non-parametric test. c The dendrogram shows the clustering based on f3-outgroup statistic (as in Fig. 1). Light and dark colors on the rows represent absence and presence of effectors, respectively. Rows were grouped using a hierarchical clustering algorithm. Labels in green and blue font denote effectors missing in clonal groups II and III, respectively

