Fig. 2.
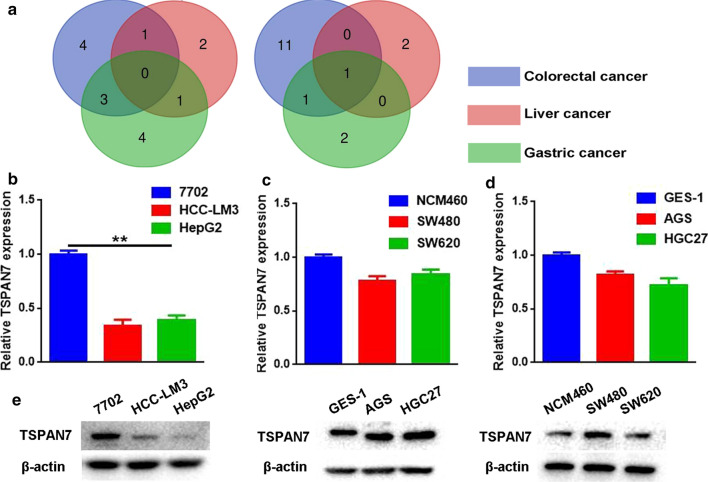
TSPAN7 expression in three types of digestive system cancer cells. a The Venn diagram is used to analyze members of the TSPAN family that are commonly overexpressed and underexpressed in three types of digestive system cancers. b qRT-PCR was employed to assess the expression of TSPAN7 in liver cancer cell lines, (c) colorectal cancer cell lines (d) and gastric cancer cell lines (n = 3). GAPDH served as an internal reference. e Western blotting was used to assess the protein levels of TSPAN7. Data represent the mean ± SD. **p < 0.01, as assessed by a Student’s t test

