Figure 4.
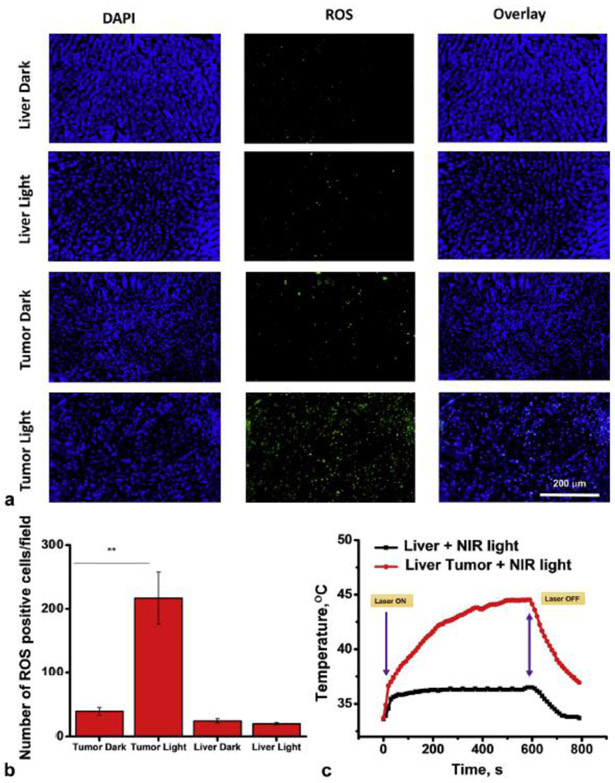
Phototherapy of VX2 liver tumor implants using SiNc-TN: A, representative images of liver and tumor implant sections stained with DAPI (blue) for cell nuclei, and H2DCFDA, a marker of ROS (green) where liver (control) and tumor tissues were harvested from the rabbit injected with SiNc-TN via transarterial delivery; B, mean numbers of ROS-positive cells per field of liver (control) and tumor sections; C, temperature profile inside of liver tumor implant recorded during the NIR phototherapy mediated by the SiNc-TN (red curve) with non-tumoral liver tissue exposed to NIR light used as the control (black curve) **P < 0.001 (n=3).

