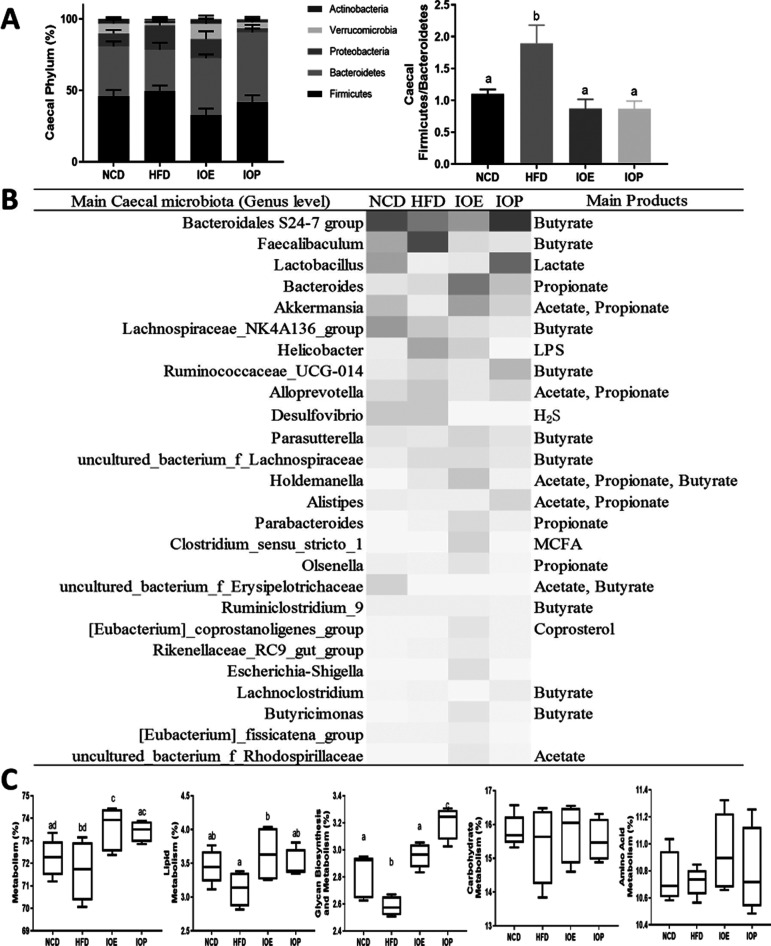
Figure 6.
Effects of IOE/IOP administration on gut microbiota. (A) Relative abundance of microbiota at the phylum level and the ratio of Firmicutes to Bacteroidetes (F/B) in the cecum. (B) Heatmaps generated by the relative abundance of cecal microbiota at the genus level. (C) Function prediction of cecal microbiota.

