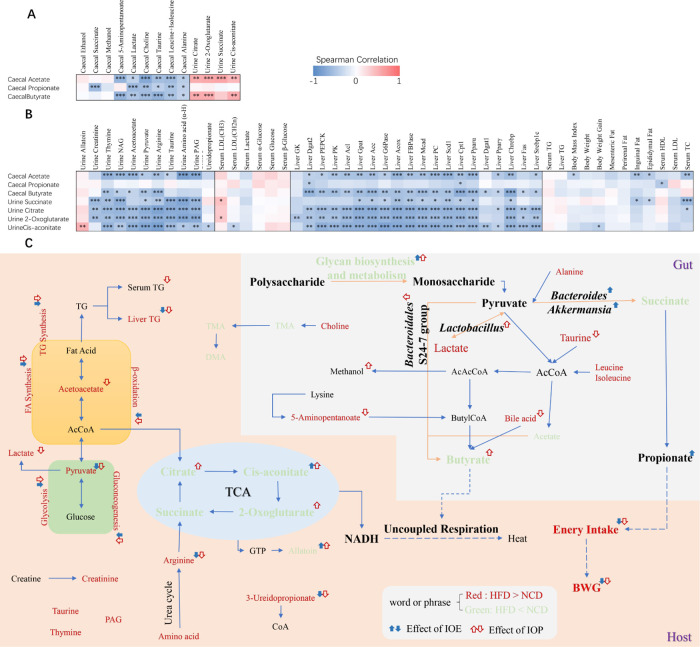
Figure 7.
Heatmaps generated by Spearman’s correlations (A, B) and schematic overview of SCFA production and obesity improvement (C). The color at each intersection of heatmaps indicates the value of the r coefficient; * indicates a significance correlation between these two parameters (*p < 0.05, **p < 0.01, ***p < 0.001).

