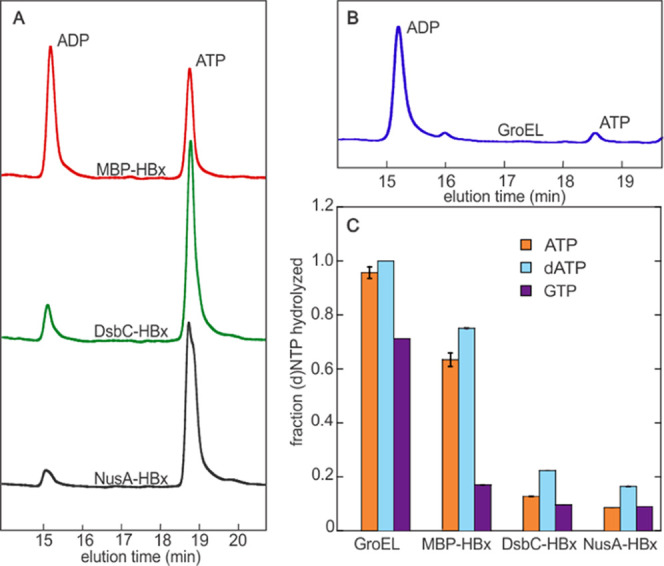
Figure 3.

Hydrolysis of (d)ATP and GTP by HBx and GroEL. (A) HPLC traces comparing the hydrolysis of ATP by MBP-HBx, DsbC-HBx, and NusA-HBx in end-point assays (20 min). (B) HPLC trace of ATP hydrolysis by GroEL in an end-point assay (20 min). (C) Fraction of (d)NTPs hydrolyzed by GroEL and HBx fusions. Data are an average of two replicates. Error bars indicate standard error. Experimental conditions: [protein] = 5 μM, [(d)NTP] = 100 μM, reaction time: 20 min.
