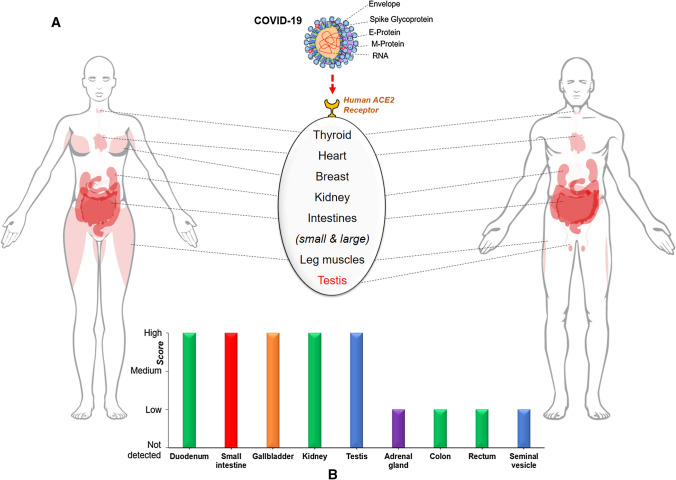
Fig. 1.
a Selective ACE2 expression in thyroid, heart, breast, kidney, intestines, leg muscles and testis. b Schematic overview of the ACE2 expression is shown for each of the nine tissues. Color-coding is based on tissue groups and no protein expression data were observed in Cerebral cortex, Cerebellum, Hippocampus, Caudate, Thyroid gland, Parathyroid gland, Nasopharynx, Bronchus, Lung, Oral mucosa, Salivary gland, Esophagus, Stomach, Liver, Pancreas, Urinary bladder, Epididymis, Prostate, Vagina, Ovary, Fallopian tube, Endometrium, Cervix, uterine, Placenta, Breast Heart muscle, Smooth muscle, Skeletal muscle, Soft tissue, Adipose tissue, Skin, Appendix, Spleen, Lymph node, Tonsil, Bone marrow tissues. The proteomic analysis is combined with RNA‐Seq on the organ, tissue, and cellular level, and all data is freely accessible on the Human Protein Atlas web portal, www.proteinatlas.org

