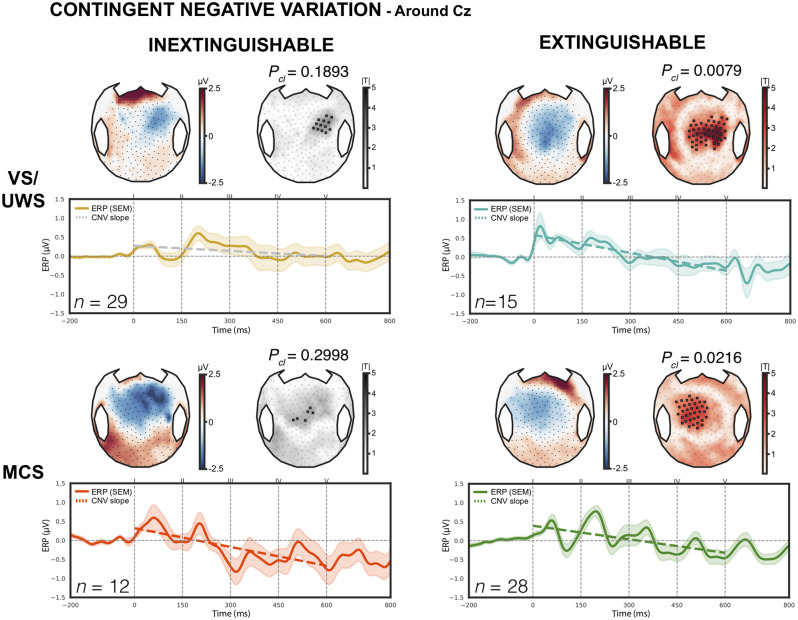
Figure 4.
Contingent negative variation. CNV elicited by the first four sounds of the local-global paradigm, with both scalp topographies on top (average values and cluster-based permutation statistics) and ERPs averaged over the Cz-centred region of interest. Coloured dashed lines indicate a significant CNV slope while grey lines indicate a non-significant slope. Only vegetative (VS/UWS) and minimally conscious (MCS) patients with extinguishable response exhibited a significant CNV in both methods, Pcl = 0.0079 and Pcl = 0.0216, respectively. Only results surviving multiple comparisons through a spatial cluster-based permutation procedure with 10 000 permutations are presented. Pcl = cluster P-value; SEM = standard error of the mean.

