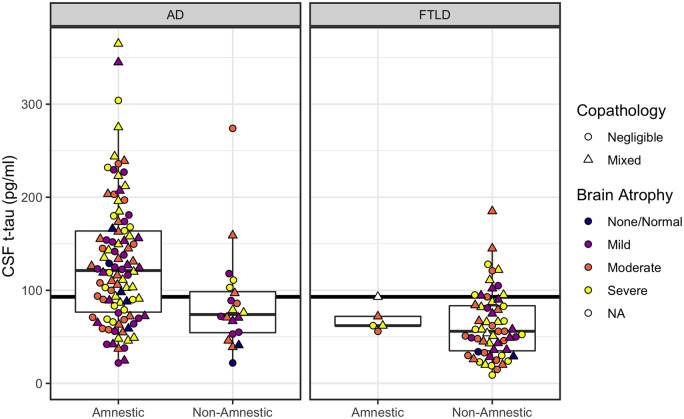
Figure 3.
CSF t-tau concentrations according to phenotype (amnestic, non-amnestic) and post-mortem ratings of brain atrophy. Left: Plots for patients with primary Alzheimer’s disease (AD) pathology. Right: Plots for patients with primary FTLD pathology. Horizontal line indicates CSF t-tau = 93 pg/ml, with patients at or above the line designated as positive for neurodegeneration (N+). CSF levels below the line are considered normal. Colour indicates severity of gross brain atrophy (white indicates cases with no available atrophy). Shape indicates presence/absence of copathology.

