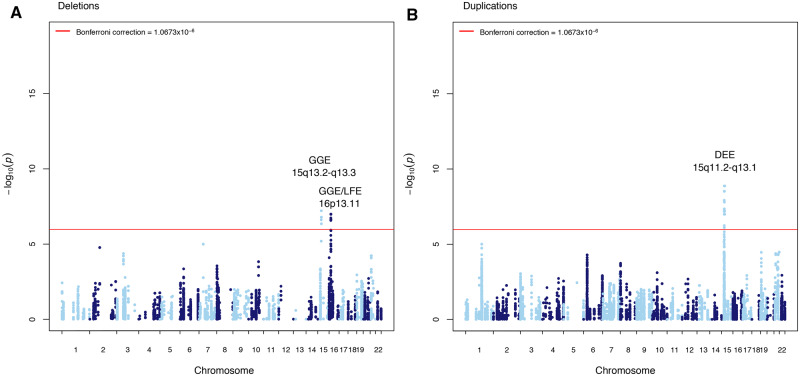
Figure 4.
Genome-wide CNV breakpoint association. Manhattan plot displaying the −log10 deviance P-value for (A) genome-wide deletion breakpoint association for DEE, GGE, LFE, and NAFE; and (B) genome-wide duplication breakpoint association for DEE, GGE, LFE, and NAFE. P-value cut-offs corresponding to correction for 46 846 tests at 1.0673 × 10⁻⁶ are highlighted in red. Loci significant after multiple test correction in the appropriate epilepsy type are labelled.

