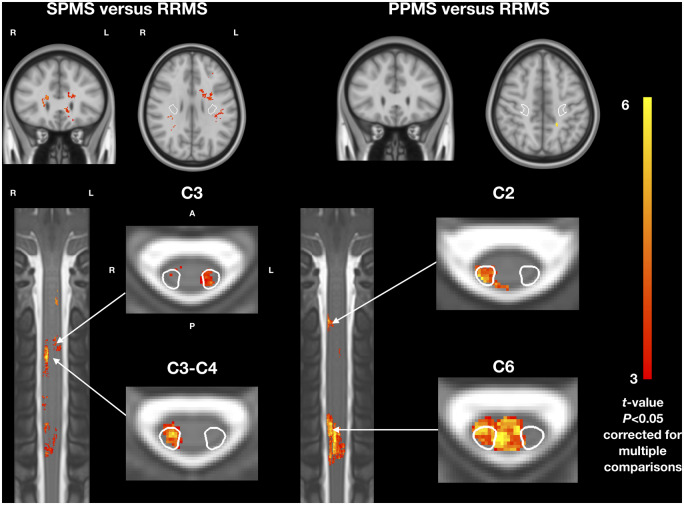
Figure 3.
T2 lesion frequency voxelwise comparison between phenotypes. (A) Patients with SPMS versus RRMS. (B) Patients with PPMS versus RRMS. Coronal and axial views. Only t-values of voxels from significant clusters are shown (P < 0.05, family-wise error corrected for multiple comparisons). All analyses were adjusted for sex, age, disease duration and scanning sites. A = anterior; P = posterior; L = left; R = right. The CST is indicated in white contour in axial views.

