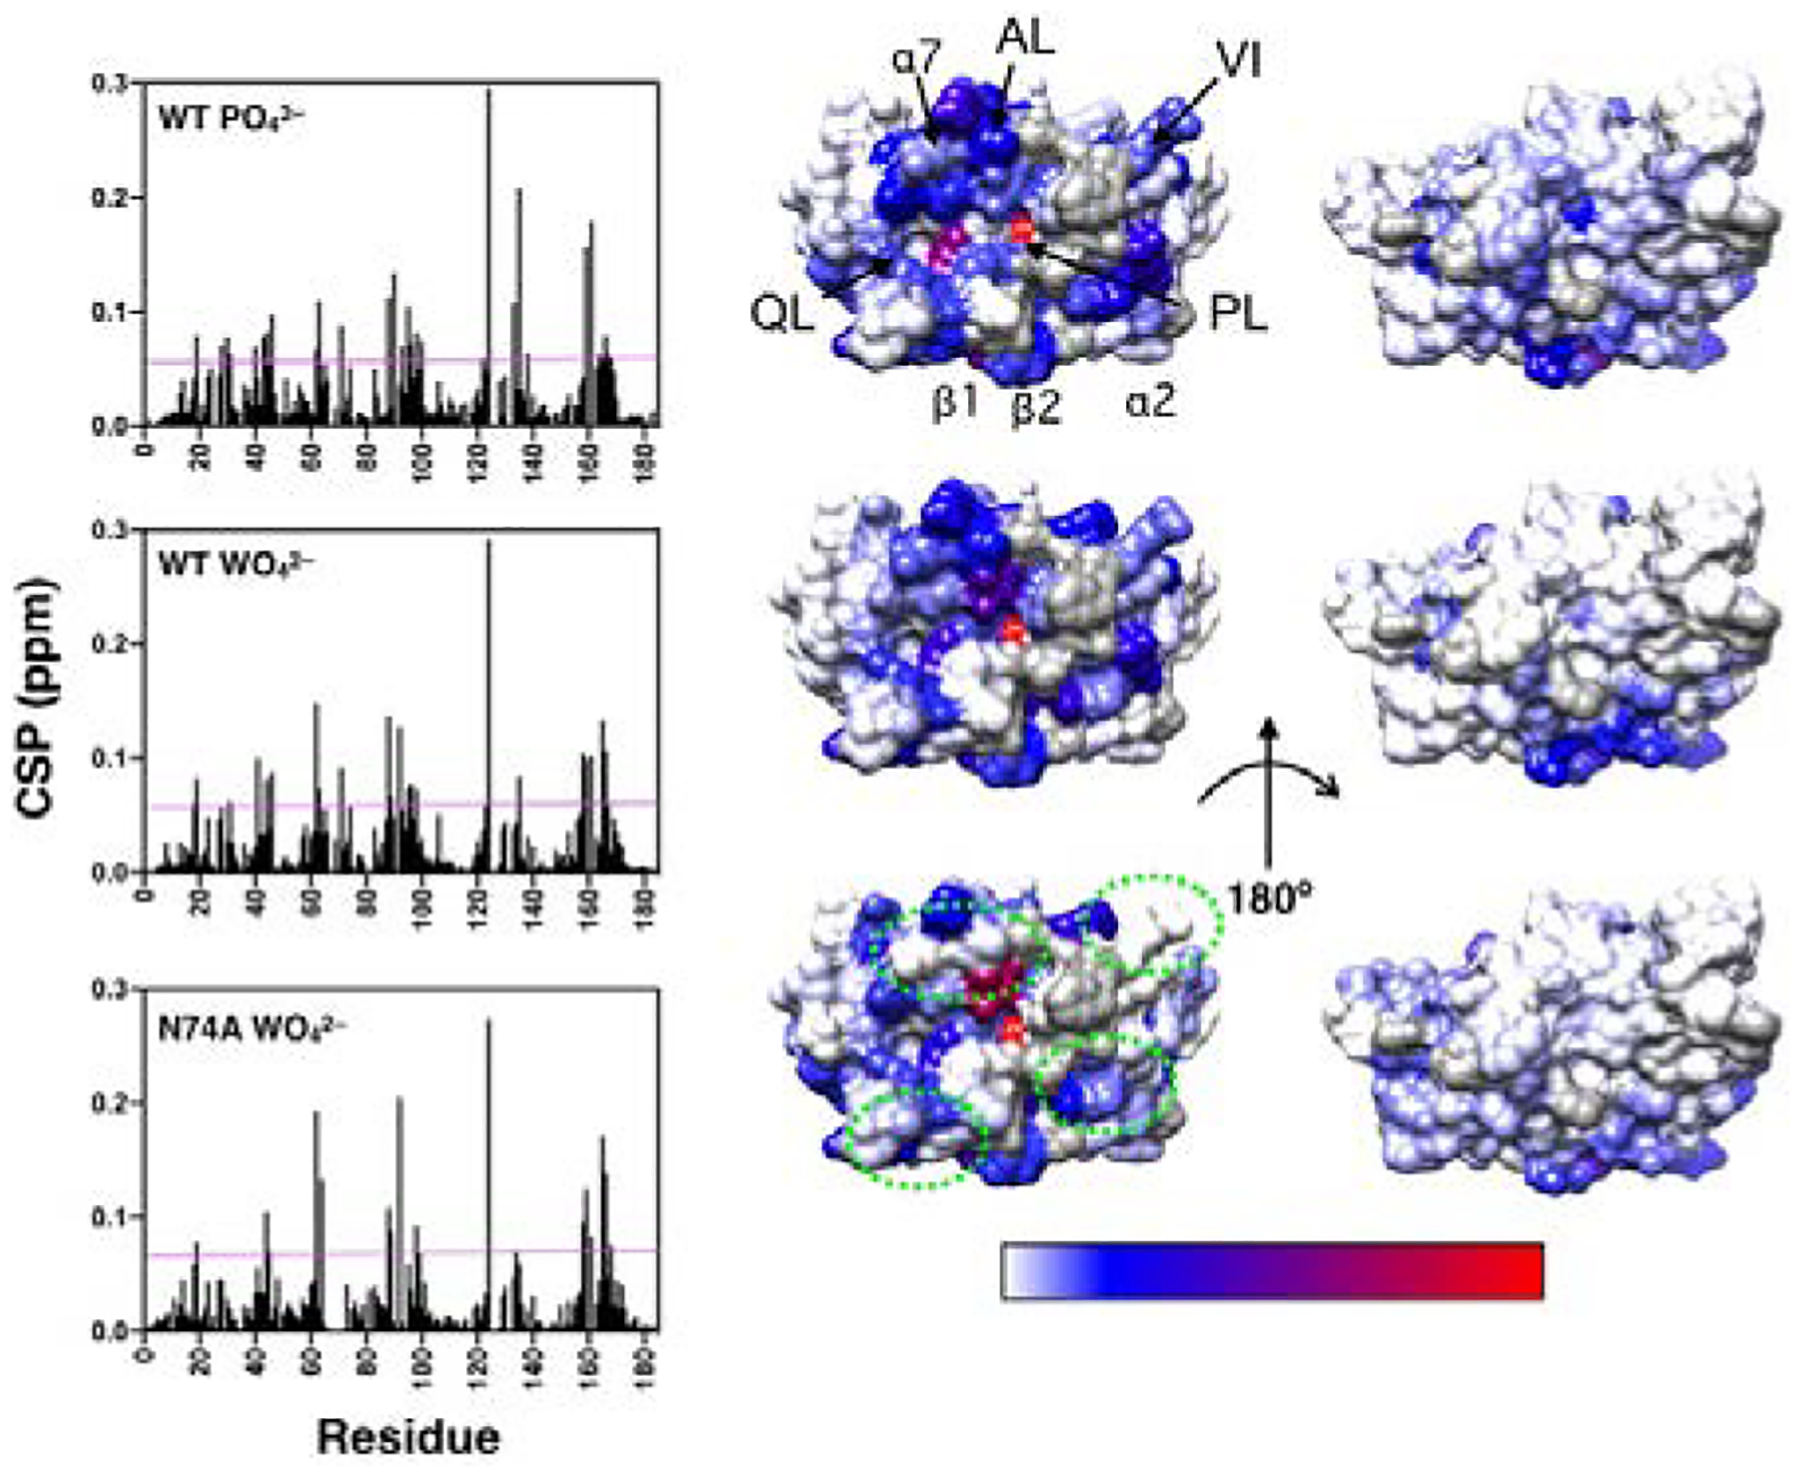
Figure 2.

Ligand-induced chemical shift perturbations (CSP). The left panel shows CSP values versus amino acid residue for WT, and N74A with the respective complexes indicated in each graph. The magenta line represents 2σ above the 10% trimmed mean value for all three data sets. The right panels show CSP values mapped onto a surface rendering of VHR shown in the same orientation as in Figure 1B. CSP values above the magenta line are mapped according to magnitude (shown in the bottom bar) ranging from blue to red. Residues with CSP below this threshold are indicated in white. Residues that are unassigned, are prolines, or have poor signal-to-noise that precludes measurement are shown in gray. Regions that show significant differences from WT in the tungstate bound complex are enclosed in green dashes. The acid loop (AL), P-loop (PL), Q-loop (QL), Variable Insert (VI), and select 2° structure elements are denoted in the top structure.
