
Figure 2.
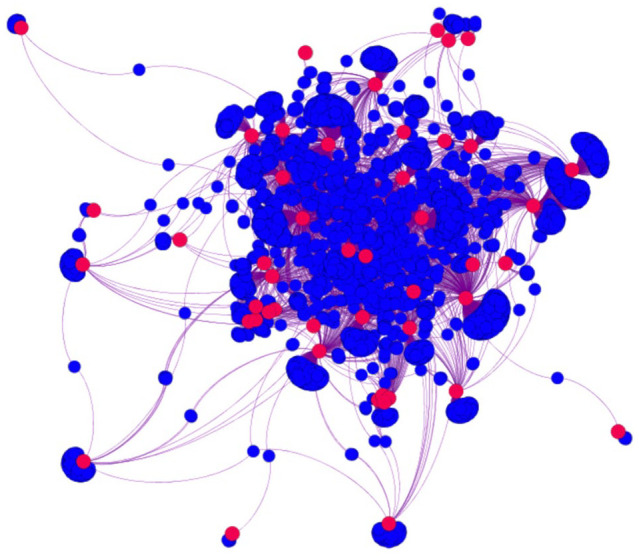
Visualization of SNP-Cancer bipartite graph. Red circles are cancers surrounded by SNPs. SNP indicates single nucleotide polymorphism.
Official websites use .gov
A
.gov website belongs to an official
government organization in the United States.
Secure .gov websites use HTTPS
A lock (
) or https:// means you've safely
connected to the .gov website. Share sensitive
information only on official, secure websites.
Visualization of SNP-Cancer bipartite graph. Red circles are cancers surrounded by SNPs. SNP indicates single nucleotide polymorphism.