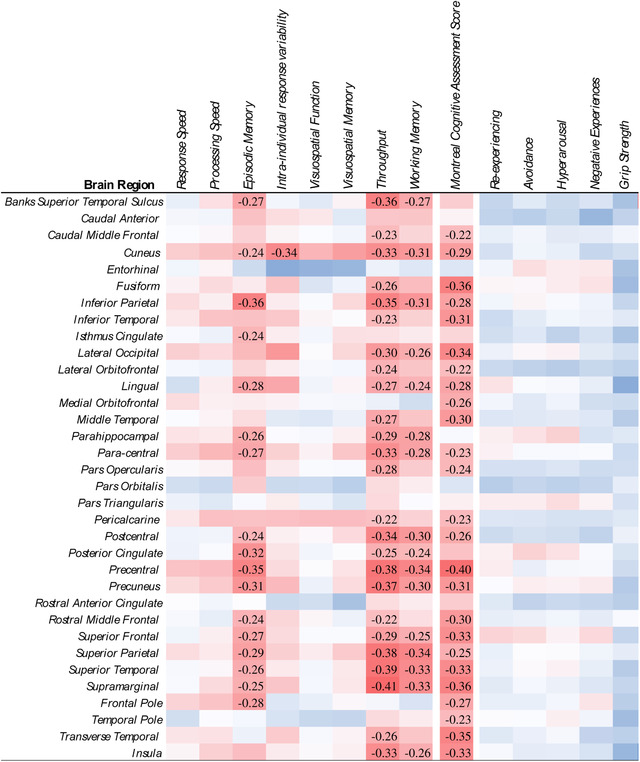
FIGURE 2.

Heat map showing levels of association between dimensional measures of cognition and posttraumatic stress disorder and regional measures of cortical thickness (CTX). Note: Coefficients were transformed so that increases in dimensional scores are consistent with worse outcomes. Stanardized Mean Differences (Cohen's D) were estimated from generalized linear modeling; all coefficients deemed statistically significant upon adjusting for the false discovery rate (FDR = 0.05) were reported. Red indicates reduced CTX; blue indicates increased CTX.
