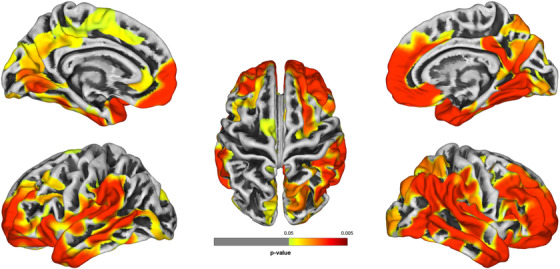
FIGURE 3.

Group‐wise analyses using surface‐based morphometry comparing cognitively impaired to cognitively unimpaired responders
Note: Group‐wise analyses using surface‐based morphometry identified areas of reduced cortical thickness (CTX) are shown since no regions with increased cortical thickness were identified. Regions lacking significant differences in CTX between groups are shown in gray; cluster locations provided in Table S2 in supporting information. Figure generated using Computational Anatomy Toolbox (CAT12)
