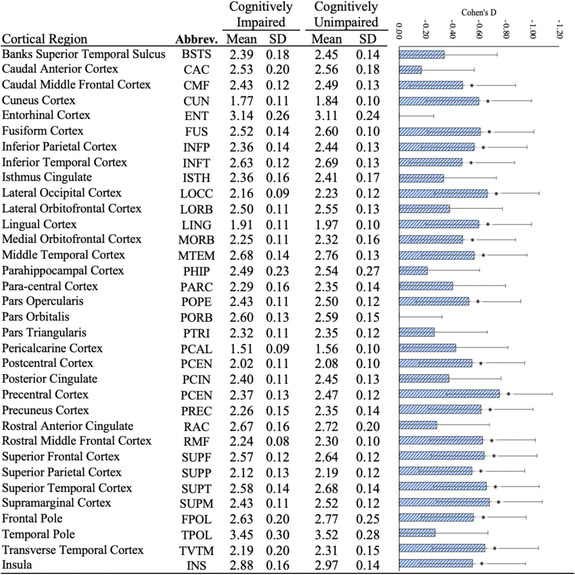
TABLE 2.
Regional estimates of mean cortical thickness and estimated standardized mean differences among cognitively impaired and cognitively unimpaired responders

|
Note: Because there were no significant positive results, only negative associations are reported. Standardized mean differences (Cohen's D) shown using blue bars with 95% confidence intervals. *Statistically significant in bivariate analyses after adjusting for the false discovery rate.
