
FIGURE 1.
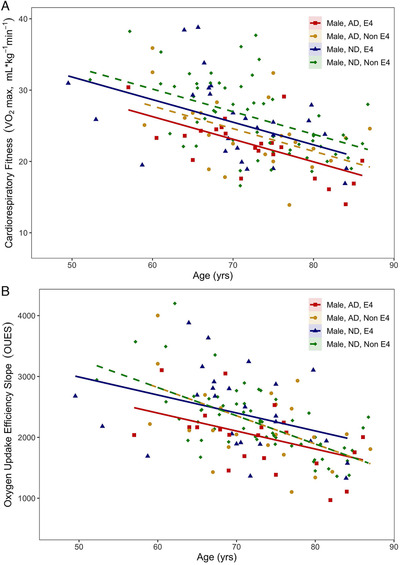
A, VO2 max and (B) oxygen uptake efficiency slope values for all male participants plotted by age and shown with the corrected regression line of best fit
Official websites use .gov
A
.gov website belongs to an official
government organization in the United States.
Secure .gov websites use HTTPS
A lock (
) or https:// means you've safely
connected to the .gov website. Share sensitive
information only on official, secure websites.
A, VO2 max and (B) oxygen uptake efficiency slope values for all male participants plotted by age and shown with the corrected regression line of best fit