
Figure 2.
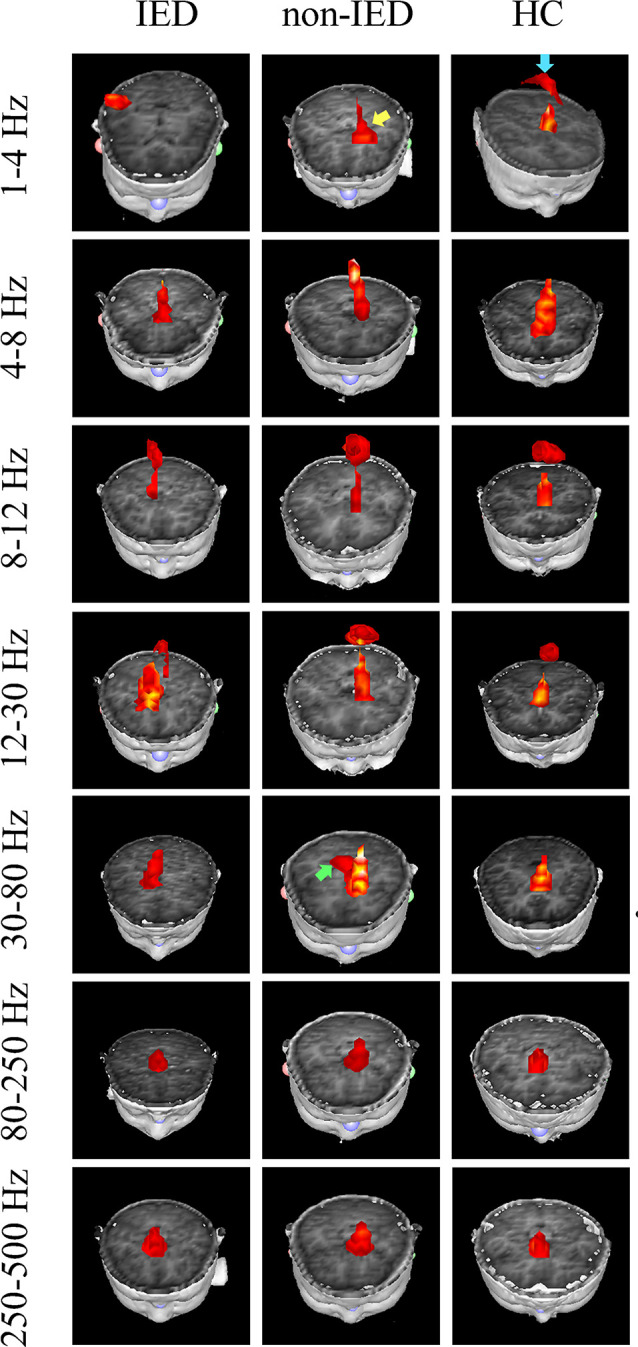
Magnetic source images showing intrinsic brain activity in a 1–500 Hz frequency range in three groups. The yellow arrow points to the region which shows a significant difference between the benign epilepsy with centrotemporal spikes (BECTS) patient with and without IEDs. Blue arrow points to the region that shows the activation in the control but not in the patient with IEDs. The green arrow indicates the predominant neuromagnetic activity between the BECTS without IEDs and the control.