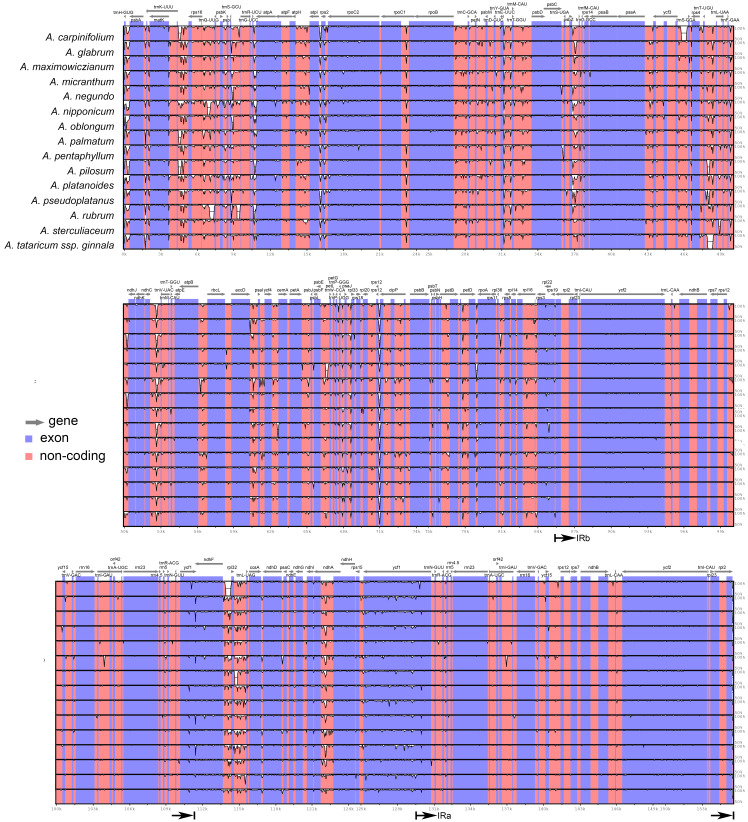
Figure 2. mVISTA alignment comparing the plastomes of Acer species against A. acuminatum.
The vertical scale to the right shows the percent of identity (50–100%) between the species compared. The black arrows indicate the boundaries of the inverted repeats. Coding regions are indicated in blue and non-coding regions in pink.

