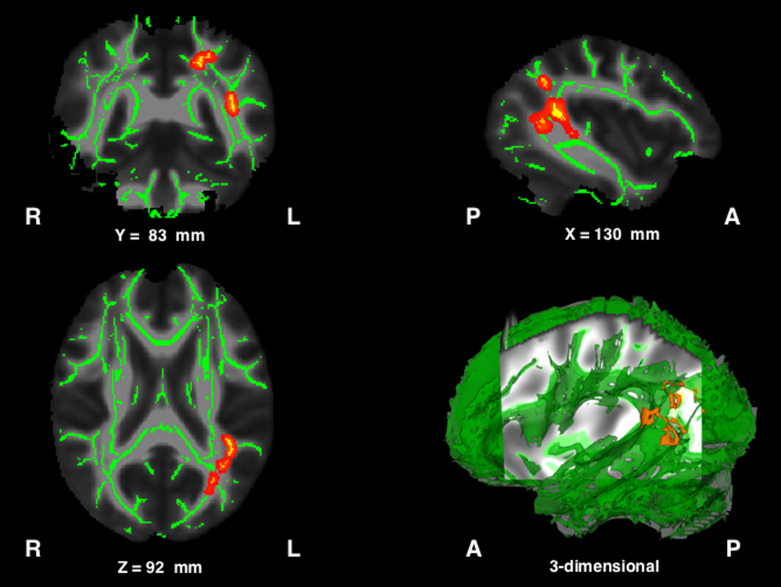
Fig. 3.
Results obtained from tract-based spatial statistics. Red–yellow areas indicate voxels where FA values were significantly lower in patients than in controls. To aid visualization, regions showing significantly lower FA values (P < 0.01) were thickened using the “tbss_fill” command implemented in FSL.

