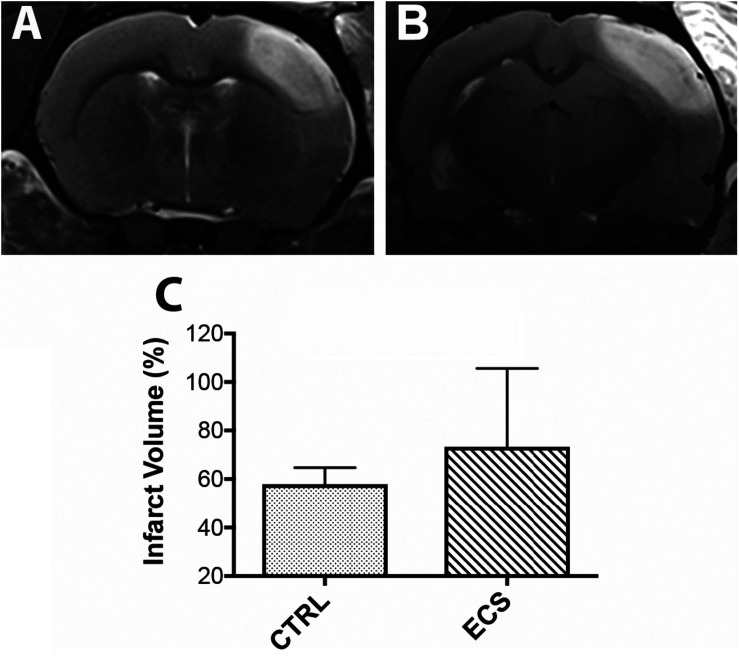
FIGURE 2.
Effect of the electrical stimulation on infarct size. (A,B) On MRI, the ischemic lesion appeared as a hyperintense area on T2-weighted images. In some animals, the infarct volume was larger in the treatment group. However, the infarct volume was not significantly (P = 0.21) changed between controls and treated animals (C).

