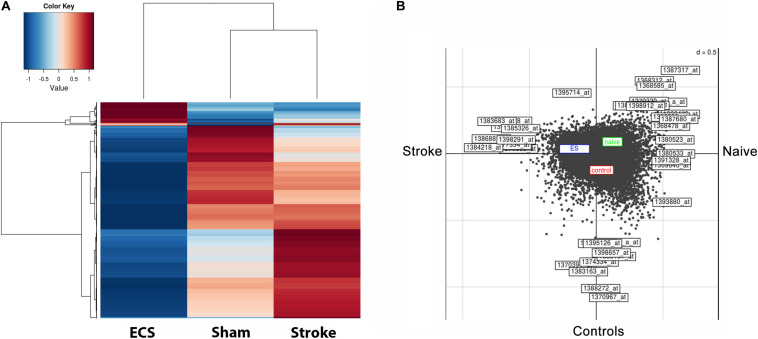
FIGURE 3.
ES-specific long-term down regulation of gene expression in the perilesional cortex after stroke. The pattern of gene expression became very dissimilar by day 48 post-stroke. The heatmap shows that relative expression values clearly distinguish ES rats from their post-stroke controls (A). The left-hand heatmap of ES animals subdivides expression levels into two major groups; the larger one consists of those probe sets whose expression is strongly down regulated in post-stroke animals than in controls and sham-operated ones, whereas the smaller group contains transcript clusters with higher expression than in controls and sham-operated ones. Further, we can clearly distinguish the ES effect shown in the blue box as compared with the red box for controls and green box for sham-operated animals. The effect of stroke is given as Axis 1, and the effect of the treatment as Axis 2 (B).

