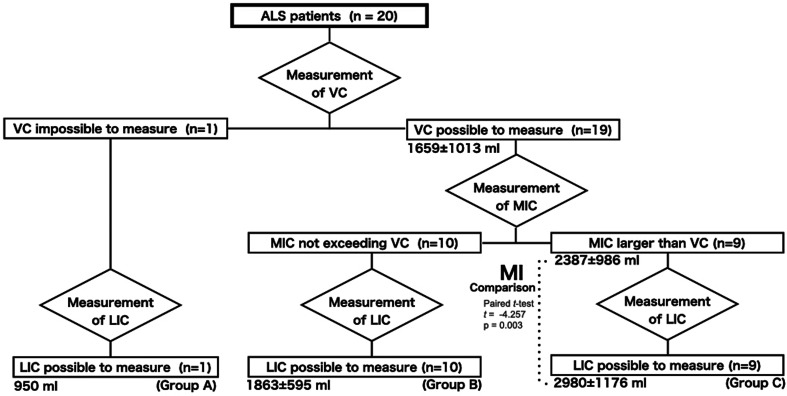
Fig. 2.
Measurement of VC, MIC, and LIC in the present study. Patients were divided into three groups: group A, VC could not be measured; group B, VC could be measured, but MIC was less than VC; and group C, MIC was larger than VC. LIC could be measured in all members of all groups. In group C, LIC was significantly greater than MIC (t=–4.257, p=0.003).

