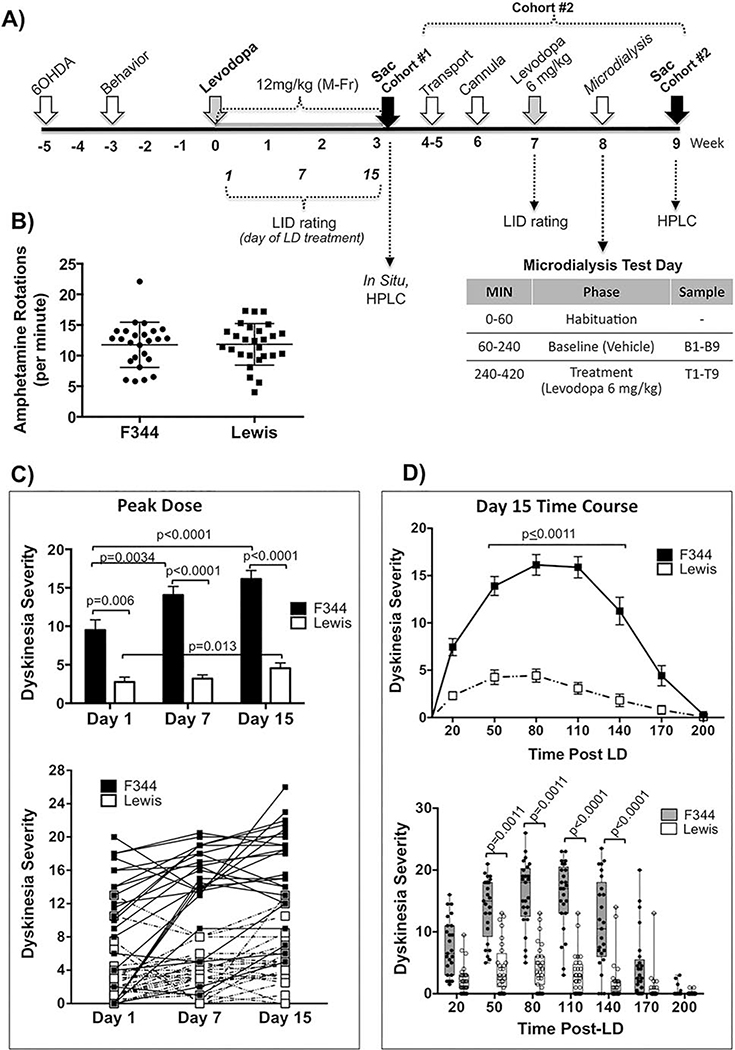
Figure 3. Effect of strain on levodopa-induced dyskinesia (LID) behavior in genetically inbred parkinsonian LID-susceptible (F344) versus LID-resistant (Lewis) rats.
A) Experimental timeline. Adult male F344 and Lewis rats were rendered parkinsonian with 6-OHDA into the SN and MFB. ‘Cohort #1’ represents Exp. 3a sacrificed for ISH and HPLC and ‘Cohort #2’ represents Exp. 3b dedicated to in vivo microdialysis measurement of extracellular striatal DA, 5HT and NE. B) Amphetamine-induced Rotational Behavior. Two weeks after 6-OHDA surgery F344 and Lewis rats were exposed to a single dose of amphetamine (5mg/kg, i.p.). Both strains of rats show equal high level of rotational behavior in response to amphetamine (p=0.6248, t=0.4924 df=46, 2-tailed unpaired t-test). Data represents counter clockwise minus clockwise (CCW-CW) rotations over 90 mins. C) Effect of strain on PEAK DOSE levodopa-induced dyskinesia (LID) behavior over time. Peak dose LID (80 mins post-levodopa) in F344 rats increased significantly over time from day 1 to day 15. At all time points examined Lewis rats remained LID resistant displaying significantly less LID severity compared to F344 rats at all time points as statistically indicated within the graphs. Upper graph: Data represent mean ± SEM; Lower graph: Individual data for each subject. Data were analyzed for effect of time using non-parametric Friedman test with post-hoc Dunn’s multiple comparison. Impact of strain on Peak Dose LID was examined with a 2-tailed Mann-Whitney U-test. D) Effect of strain TIME COURSE of levodopa-induced dyskinesia (LID) behavior. Data shown here represents the time course of LID on the final day (Day 15) of levodopa treatment. Upper graph: Data as mean ± SEM. Lower graph: Data as Box & Whisker graph to show data distribution between strains. All time points between 50 and 140 mins post-levodopa (LD) Lewis rats displayed significantly less LID severity compared to F344 rats. Data were analyzed using non-parametric Kruskal-Wallis test (H=236.5, p<0.0001) with post-hoc Dunn’s multiple comparison. All graphed data (B-D) includes rats used in Exp. 3a and 3b, as well as extra rats not presented here (N=25 for F344; N=27 for Lewis).

