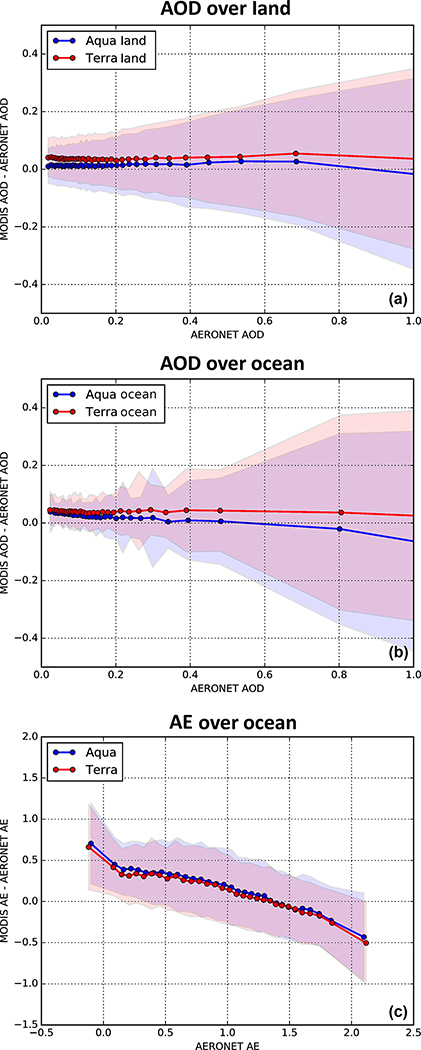
Figure 2:
Statistics of MxD04-AERONET difference as a function of AERONET values for AOD (0.55 μm) over land (A) and ocean (B), and for AE over ocean (C). For each panel, data from MOD04 (MYD04) are plotted in red (blue). For each sensor, the dots (and connecting lines) represent the mean of the MxD04-AERONET difference whereas the shaded area represents the middle ±1σ of the difference. Note each MxD04 is compared separately to AERONET, and that the AERONET data are ordered into bins with equal number of points.

