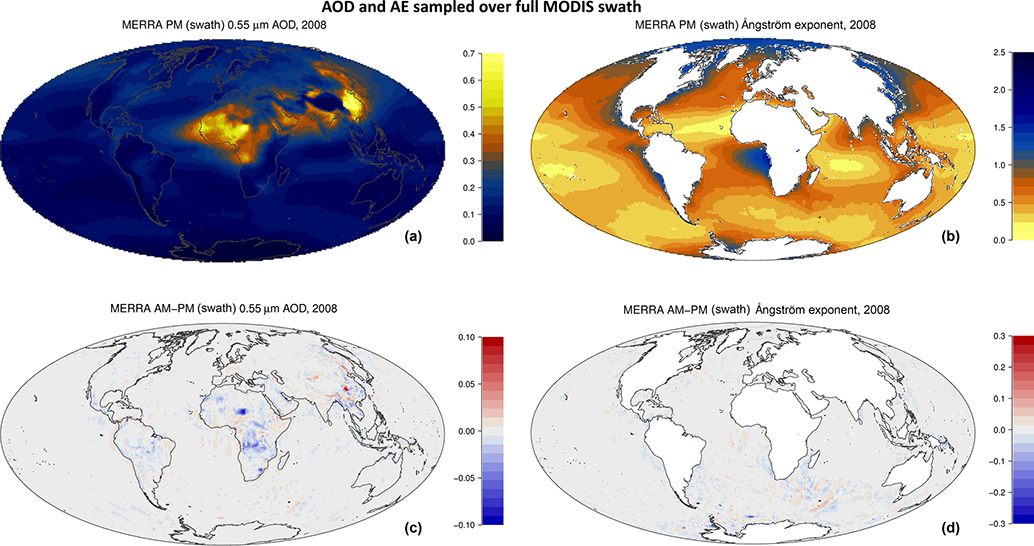
Figure 7:
Gridded (0.625° x 0.5°) global mean AOD (at 0.55 μm - left panels) and AE (0.55/0.86 - right panels) μm for 2008, derived from sampling of MERRA-2 along the MODIS swaths. Top panels: Derived from PM sampling (like MODIS-A), Bottom panels: Difference between AM (MODIS-T) and PM (MODIS-A) swaths.

