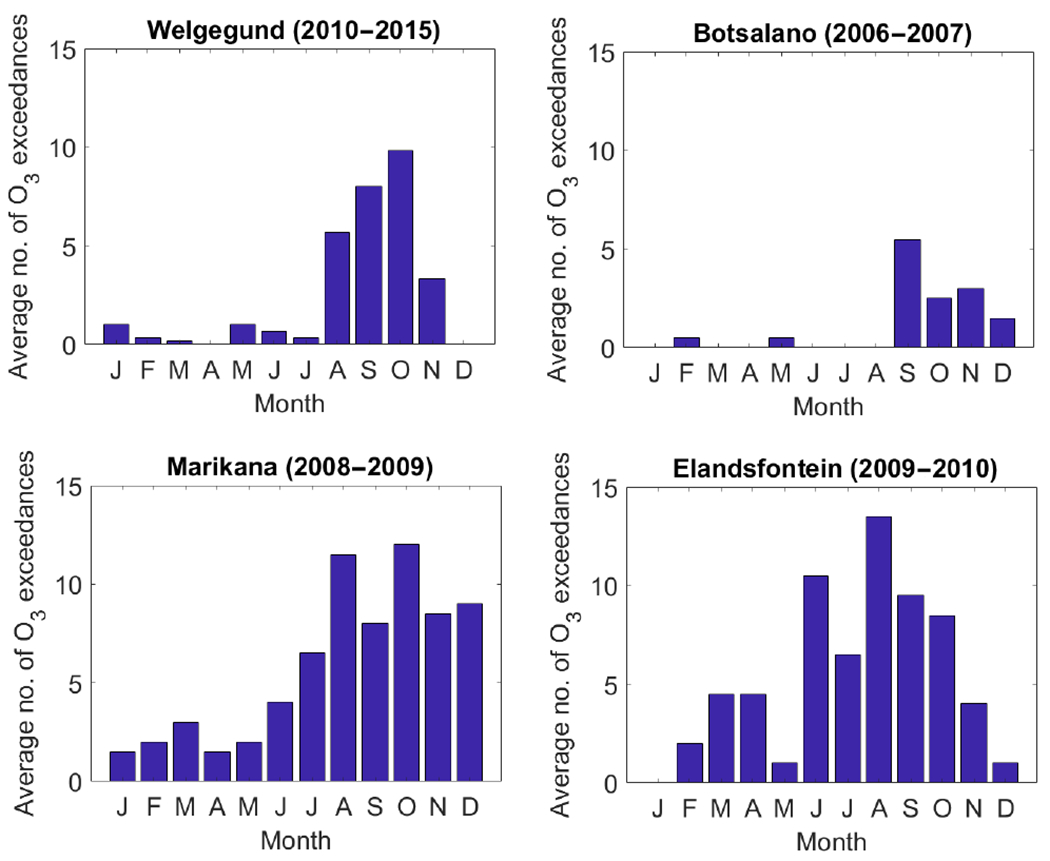
Figure 11.

Monthly number of exceedances of the daily 8h O3 maximum (i.e. highest value of all available 8 h moving averages in that day) above 61 ppbv at Welgegund, Botsalano, Marikana, and Elandsfontein.

Monthly number of exceedances of the daily 8h O3 maximum (i.e. highest value of all available 8 h moving averages in that day) above 61 ppbv at Welgegund, Botsalano, Marikana, and Elandsfontein.