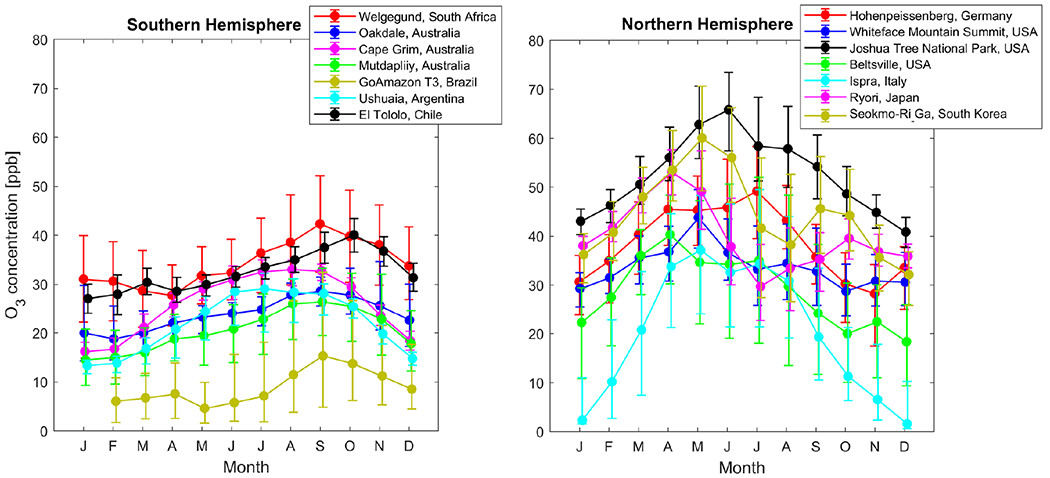
Figure 4.

Seasonal cycle of O3 at rural sites in other parts of the world. The dots indicate monthly median (50th percentile) and the upper and lower limits the 25th and 75th percentiles, respectively, for monthly O3 concentrations. The data are averaged from May 2010 to December 2014, except in a few instances in which 2014 data were not available.
