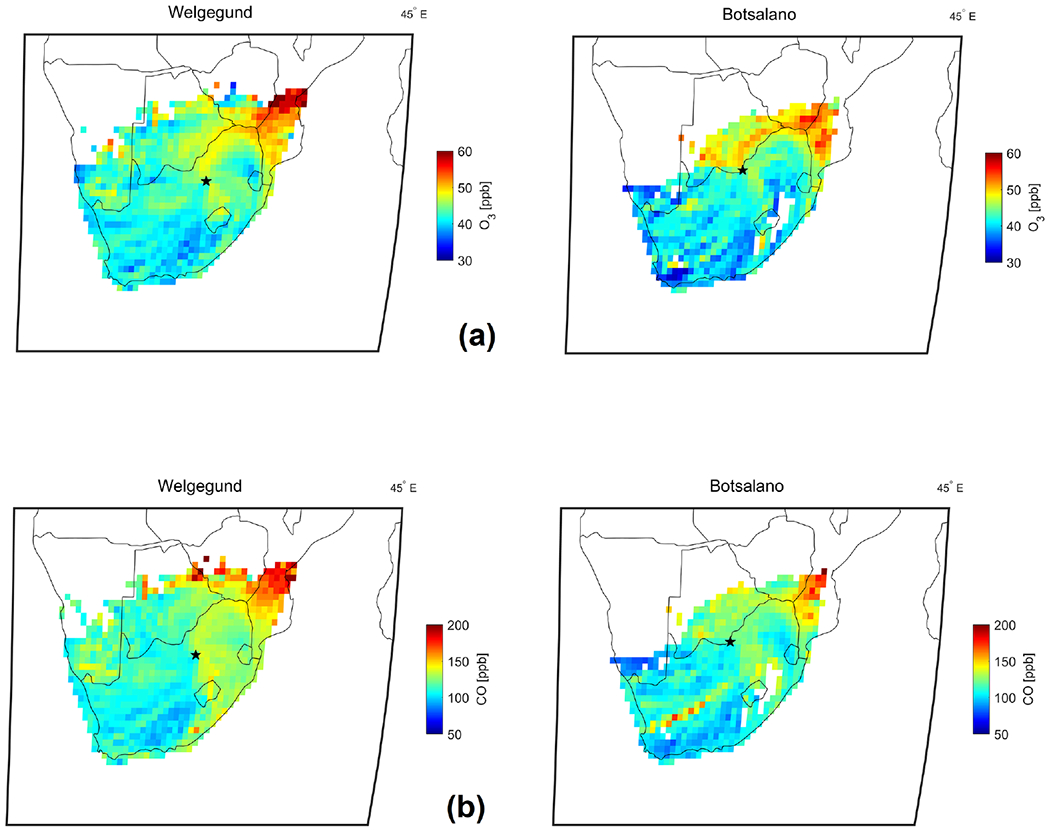
Figure 5.

Source area maps of (a) O3 concentrations and (b) CO concentrations for the background sites Welgegund and Botsalano. The black star represents the measurement site and the colour of each pixel represents the mean concentration of the respective gas species. At least 10 observations per pixel are required.
