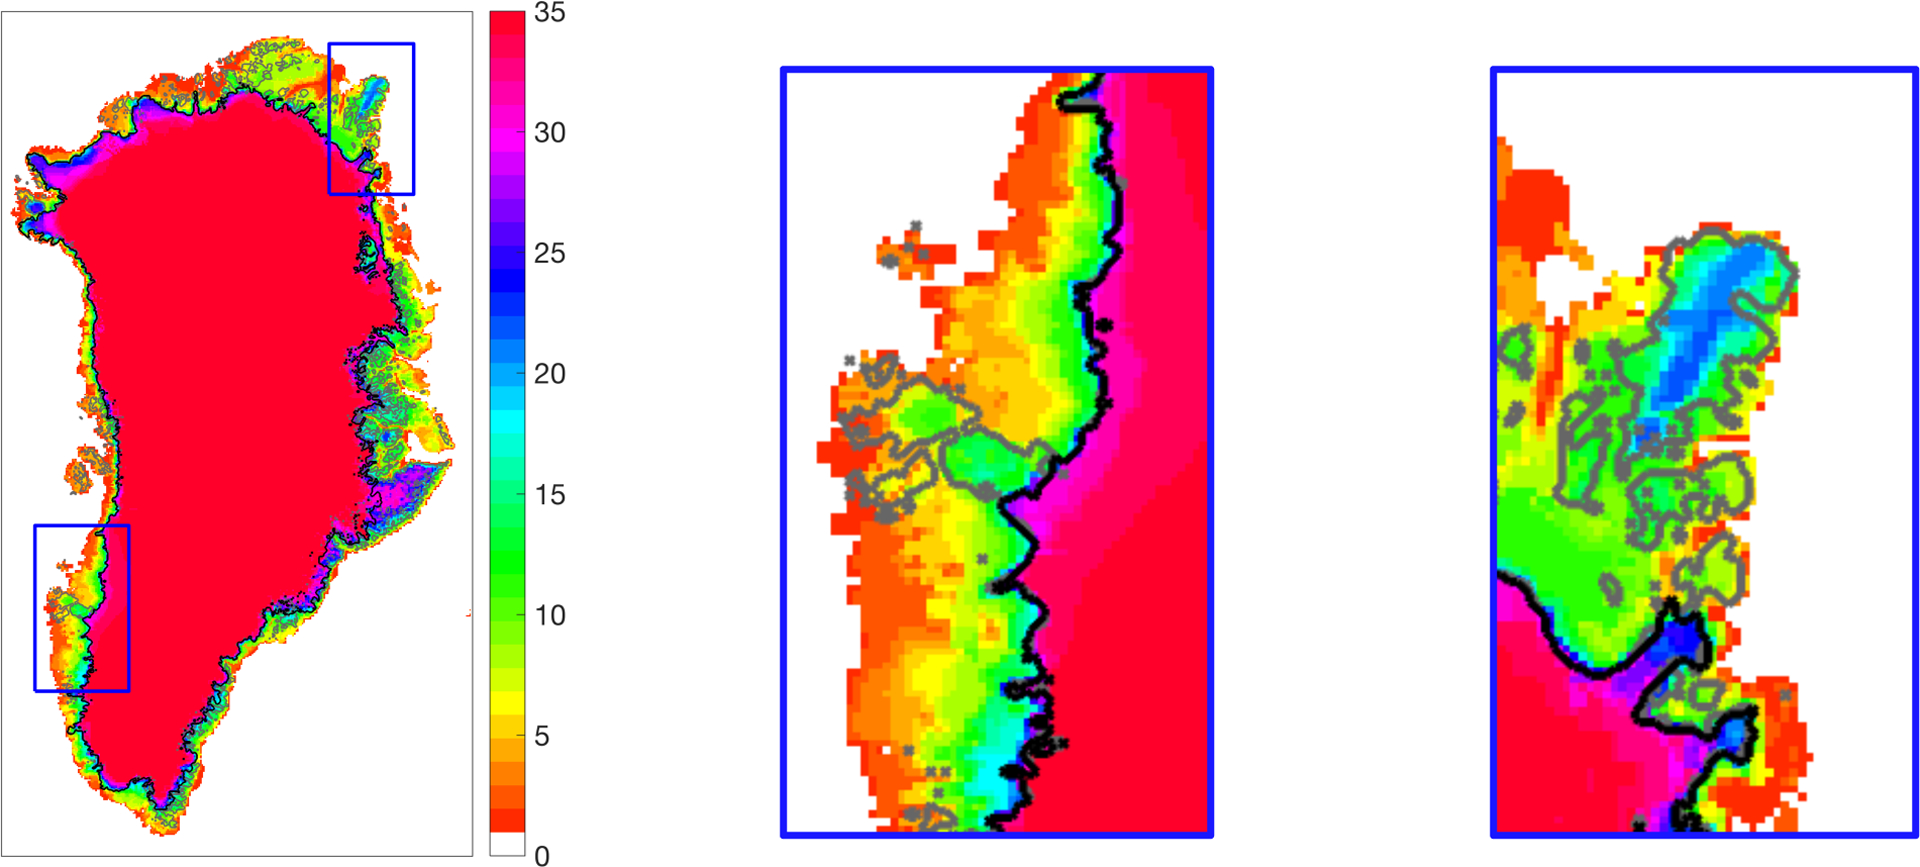
Figure 1.

Common ice mask of the ensemble of models in the intercomparison. The colour code indicates the number of models (out of 35 in total) that simulate ice at a given location. Outlines of the observed ice sheet proper (Rastner et al., 2012) and all ice-covered regions (i.e. main ice sheet plus small ice caps and glaciers; Morlighem et al. 2014) are given as black and grey contour lines, respectively. A complete set of figures displaying individual model results is given in the supplementary material.
