
Figure 3.
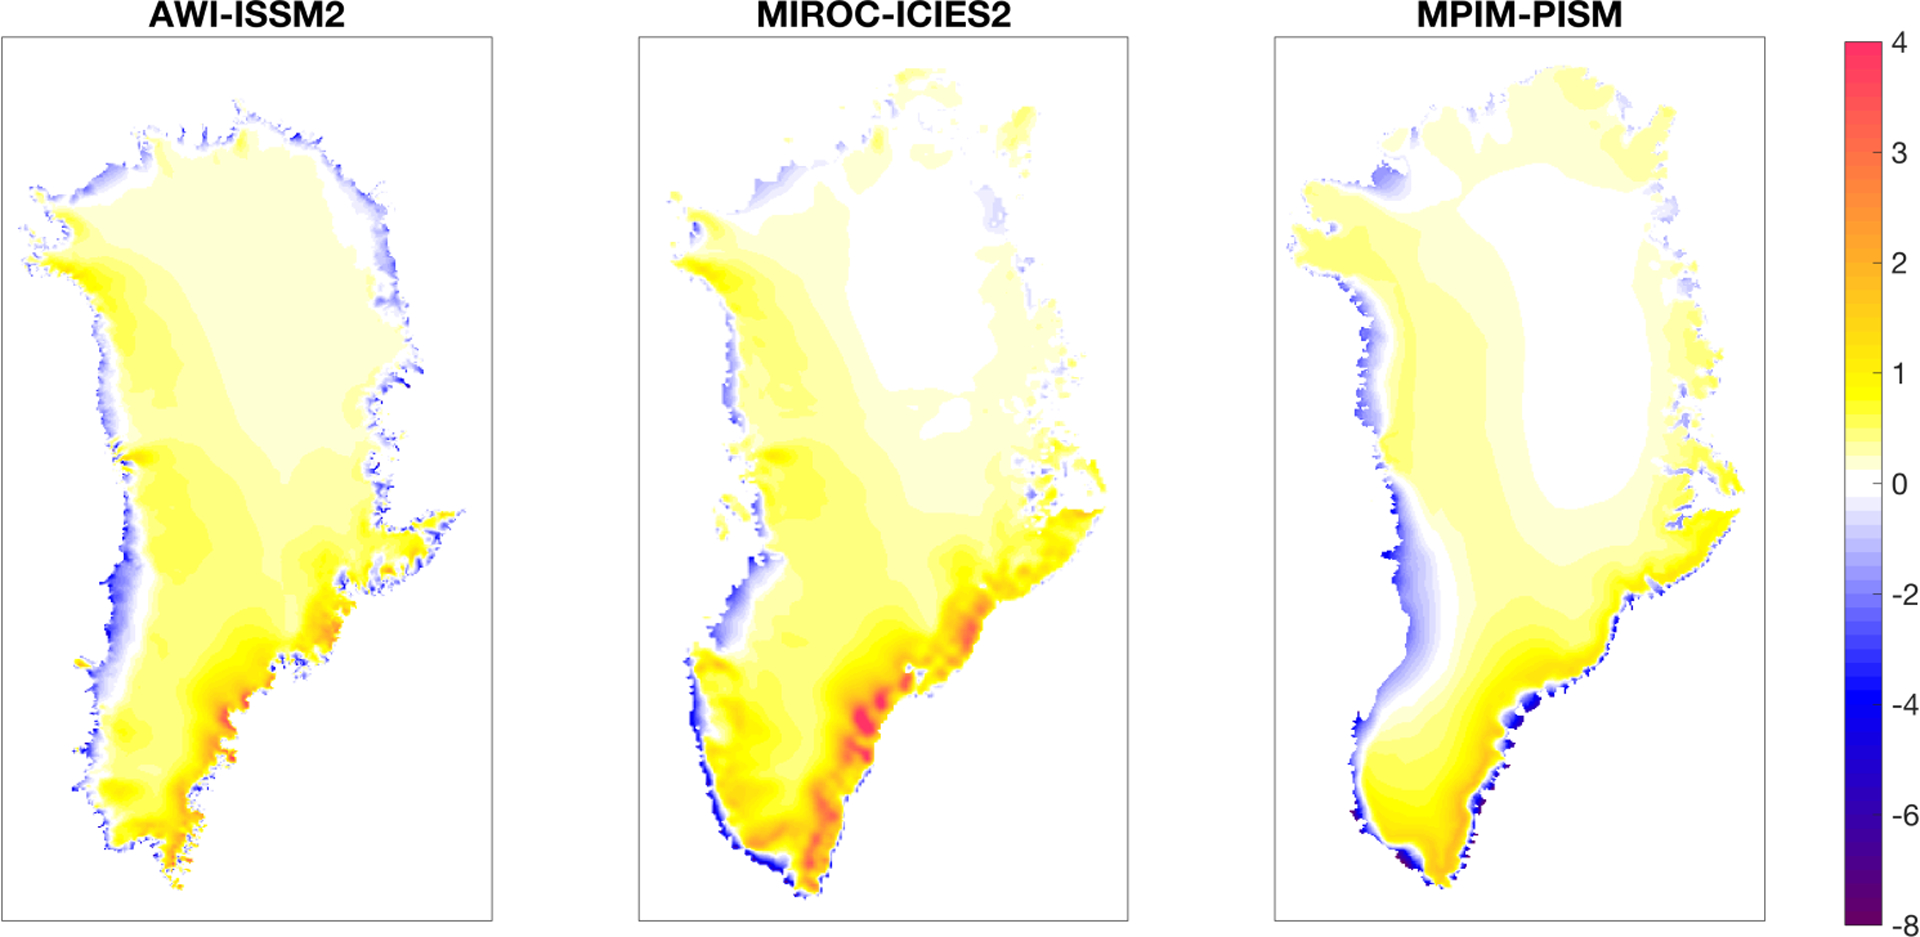
Typical surface mass balance for the initial state for three different models. Note the unequal scaling for positive and negative values.
Official websites use .gov
A
.gov website belongs to an official
government organization in the United States.
Secure .gov websites use HTTPS
A lock (
) or https:// means you've safely
connected to the .gov website. Share sensitive
information only on official, secure websites.
Typical surface mass balance for the initial state for three different models. Note the unequal scaling for positive and negative values.