
Figure 8.
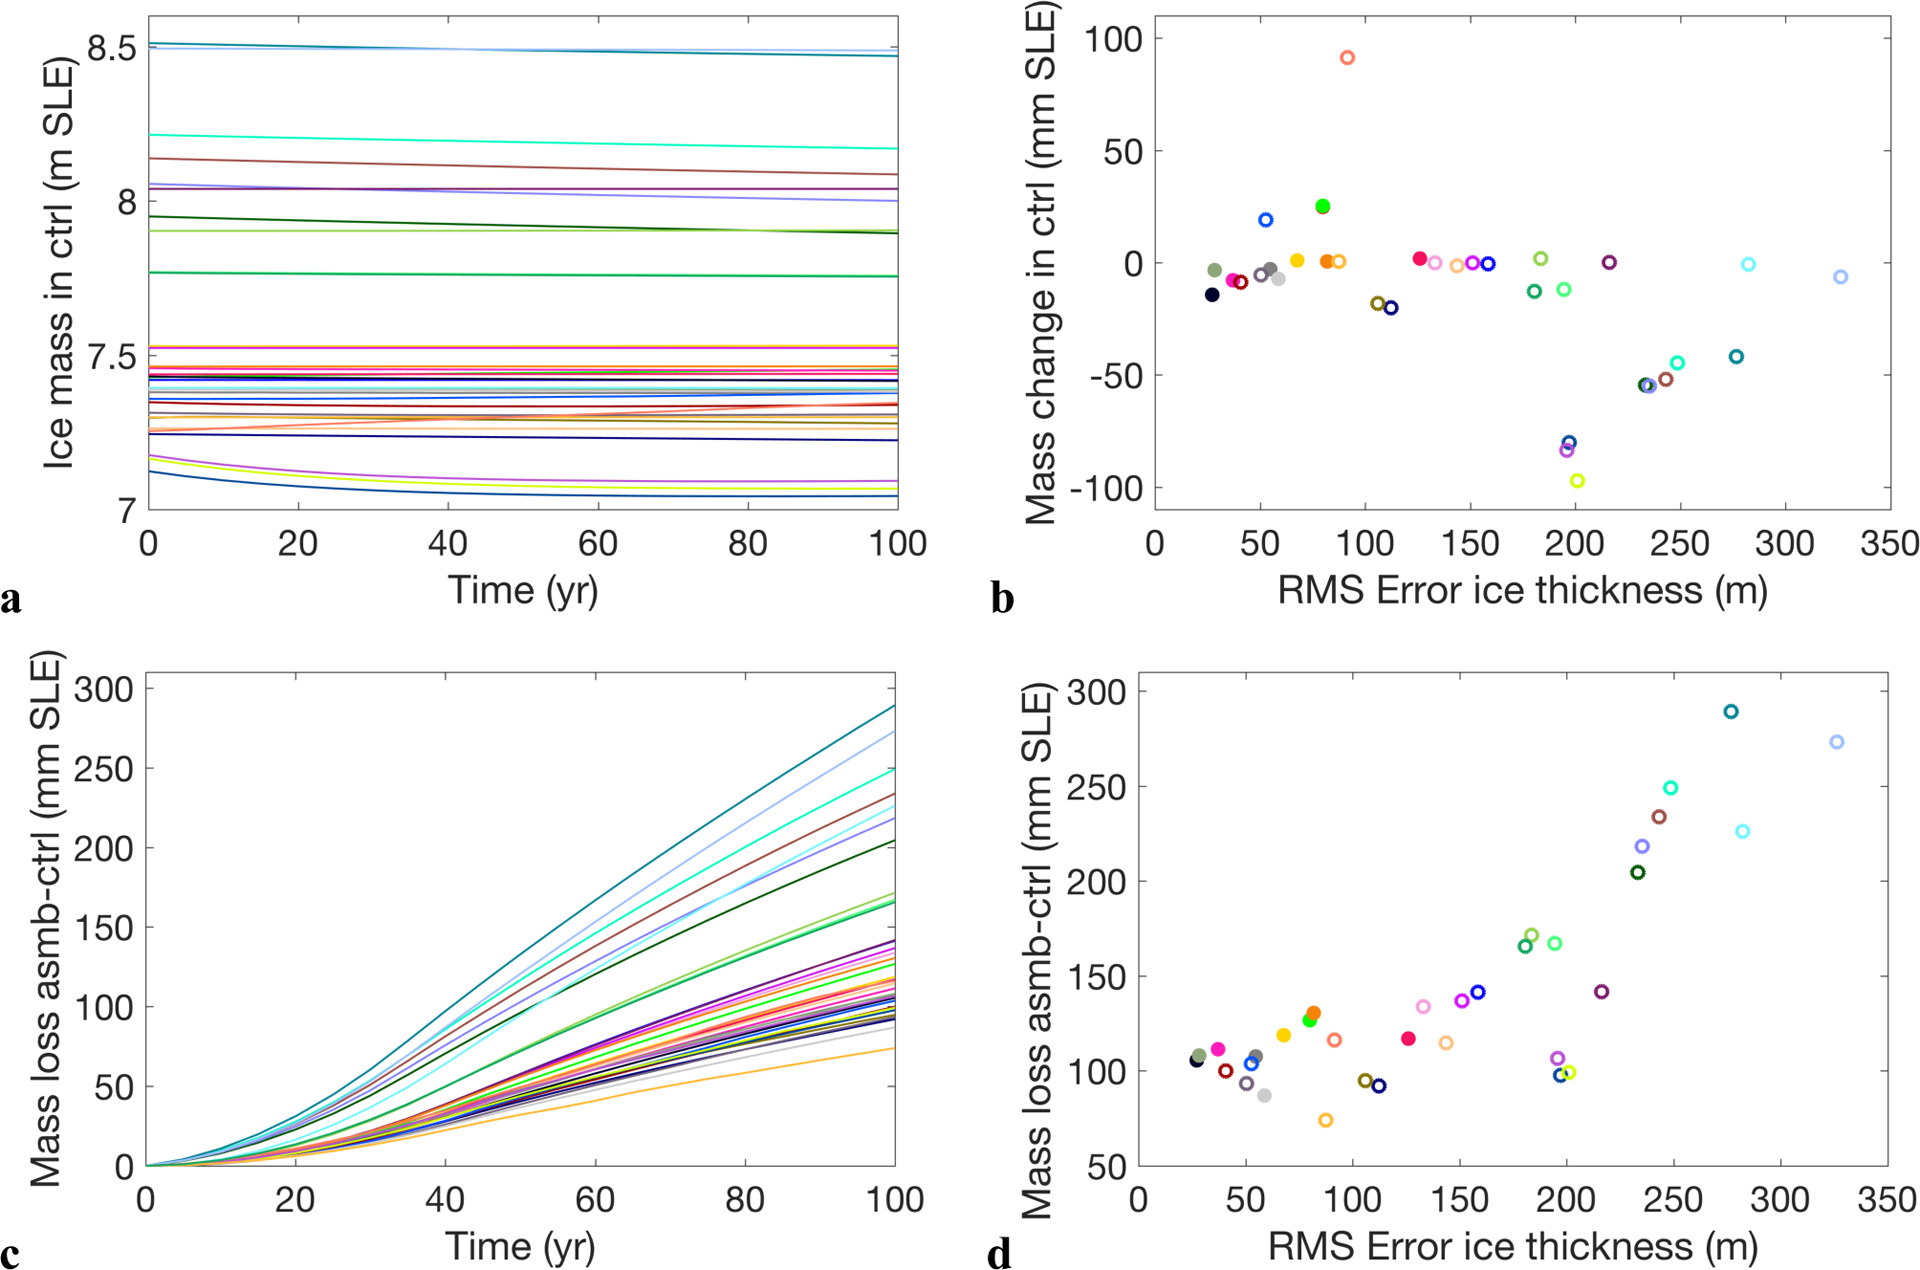
Ice mass evolution in ctrl (a) and ice mass loss from asmb-ctrl (c). Mass change after 100 years in experiment ctrl (b) and from asmb-ctrl (d) related to error in initial ice thickness. Ice volume changes have been converted to sea-level equivalent (SLE) assuming an ocean area of 361.8 *106 km2 and the specific ice density from the individual ice sheet models. Filled symbols in (b) and (d) represent DAv models. Data in (b) and (d) is available in supplementary Table S1.