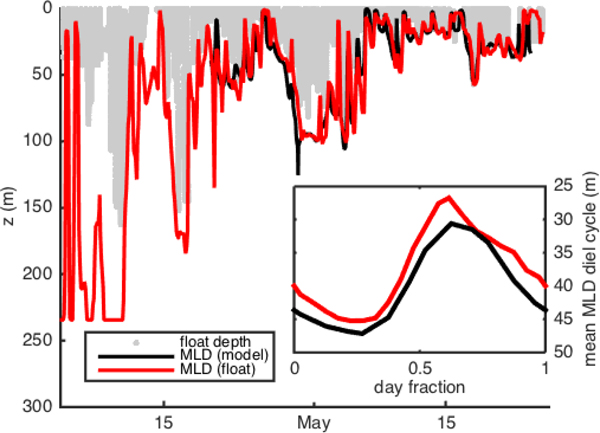
Fig. 3.
Hourly mixed-layer depth estimates calculated directly from float density measurements and from the Bagniewski et al. (2011) data assimilation model (black line), along with the depth of the float in mixed-layer mode (red line). Inset shows mean MLD diel cycle over the entire duration of the model (April 21-May 24). All MLD estimates use a density threshold of 0.01 kg m−3 to better approximate active mixing on an hourly timescale.

