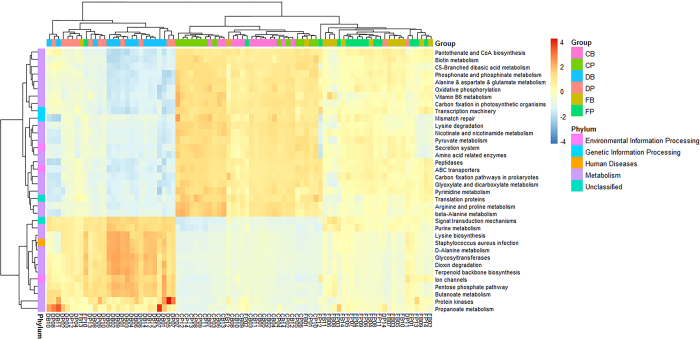
Figure 8. Heat map showing the different abundances of functions predicted by KEGG among duodenum, cecum and feces.
CB, DB and FB denote better feed efficiency groups in cecum, duodenum and feces, respectively. CP, DP and FP denote poor feed efficiency groups in cecum, duodenum and feces, respectively.

