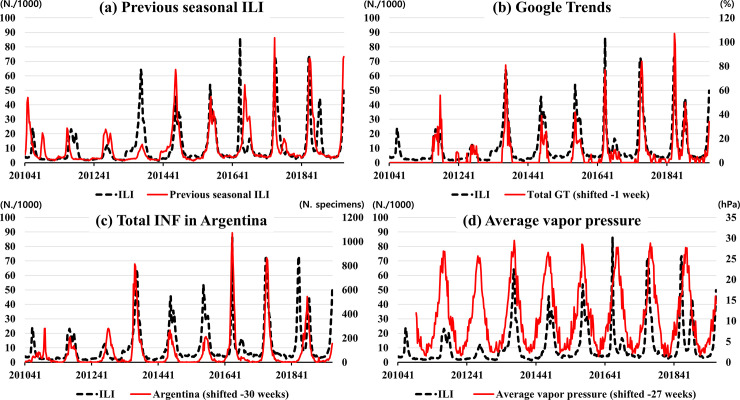
Fig 3.
Correlation between ILI in South Korea and selected variables from 2010 to 2019; previous seasonal ILI (a), Google Trends (b), influenza in Argentina (c), and average vapor pressure (d). The black line denotes the reference levels, and the red line is input variables. GT, Google Trends; INF, Influenza; ILI, Influenza-like illness.

