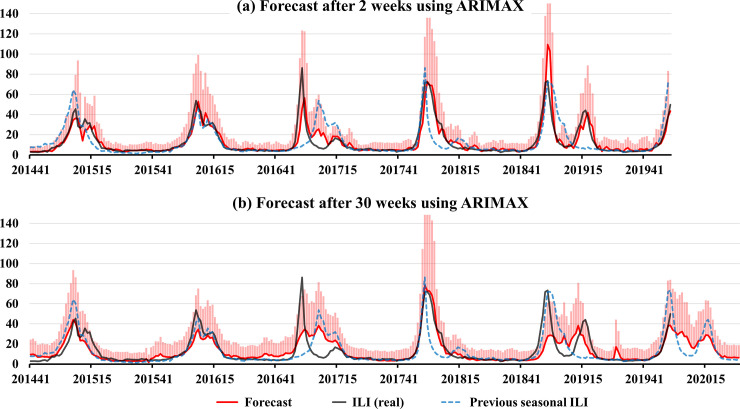
Fig 4. The prediction of ILI after 2 and 30 weeks in South Korea from the 41st week of 2015 to the 52nd week of 2019.
The black line denotes ILI in South Korea, the red line denotes the prediction values, the dotted gray line denotes previous seasonal ILI, and the pink bars represent the 50% confidence intervals.

