
Figure 3.

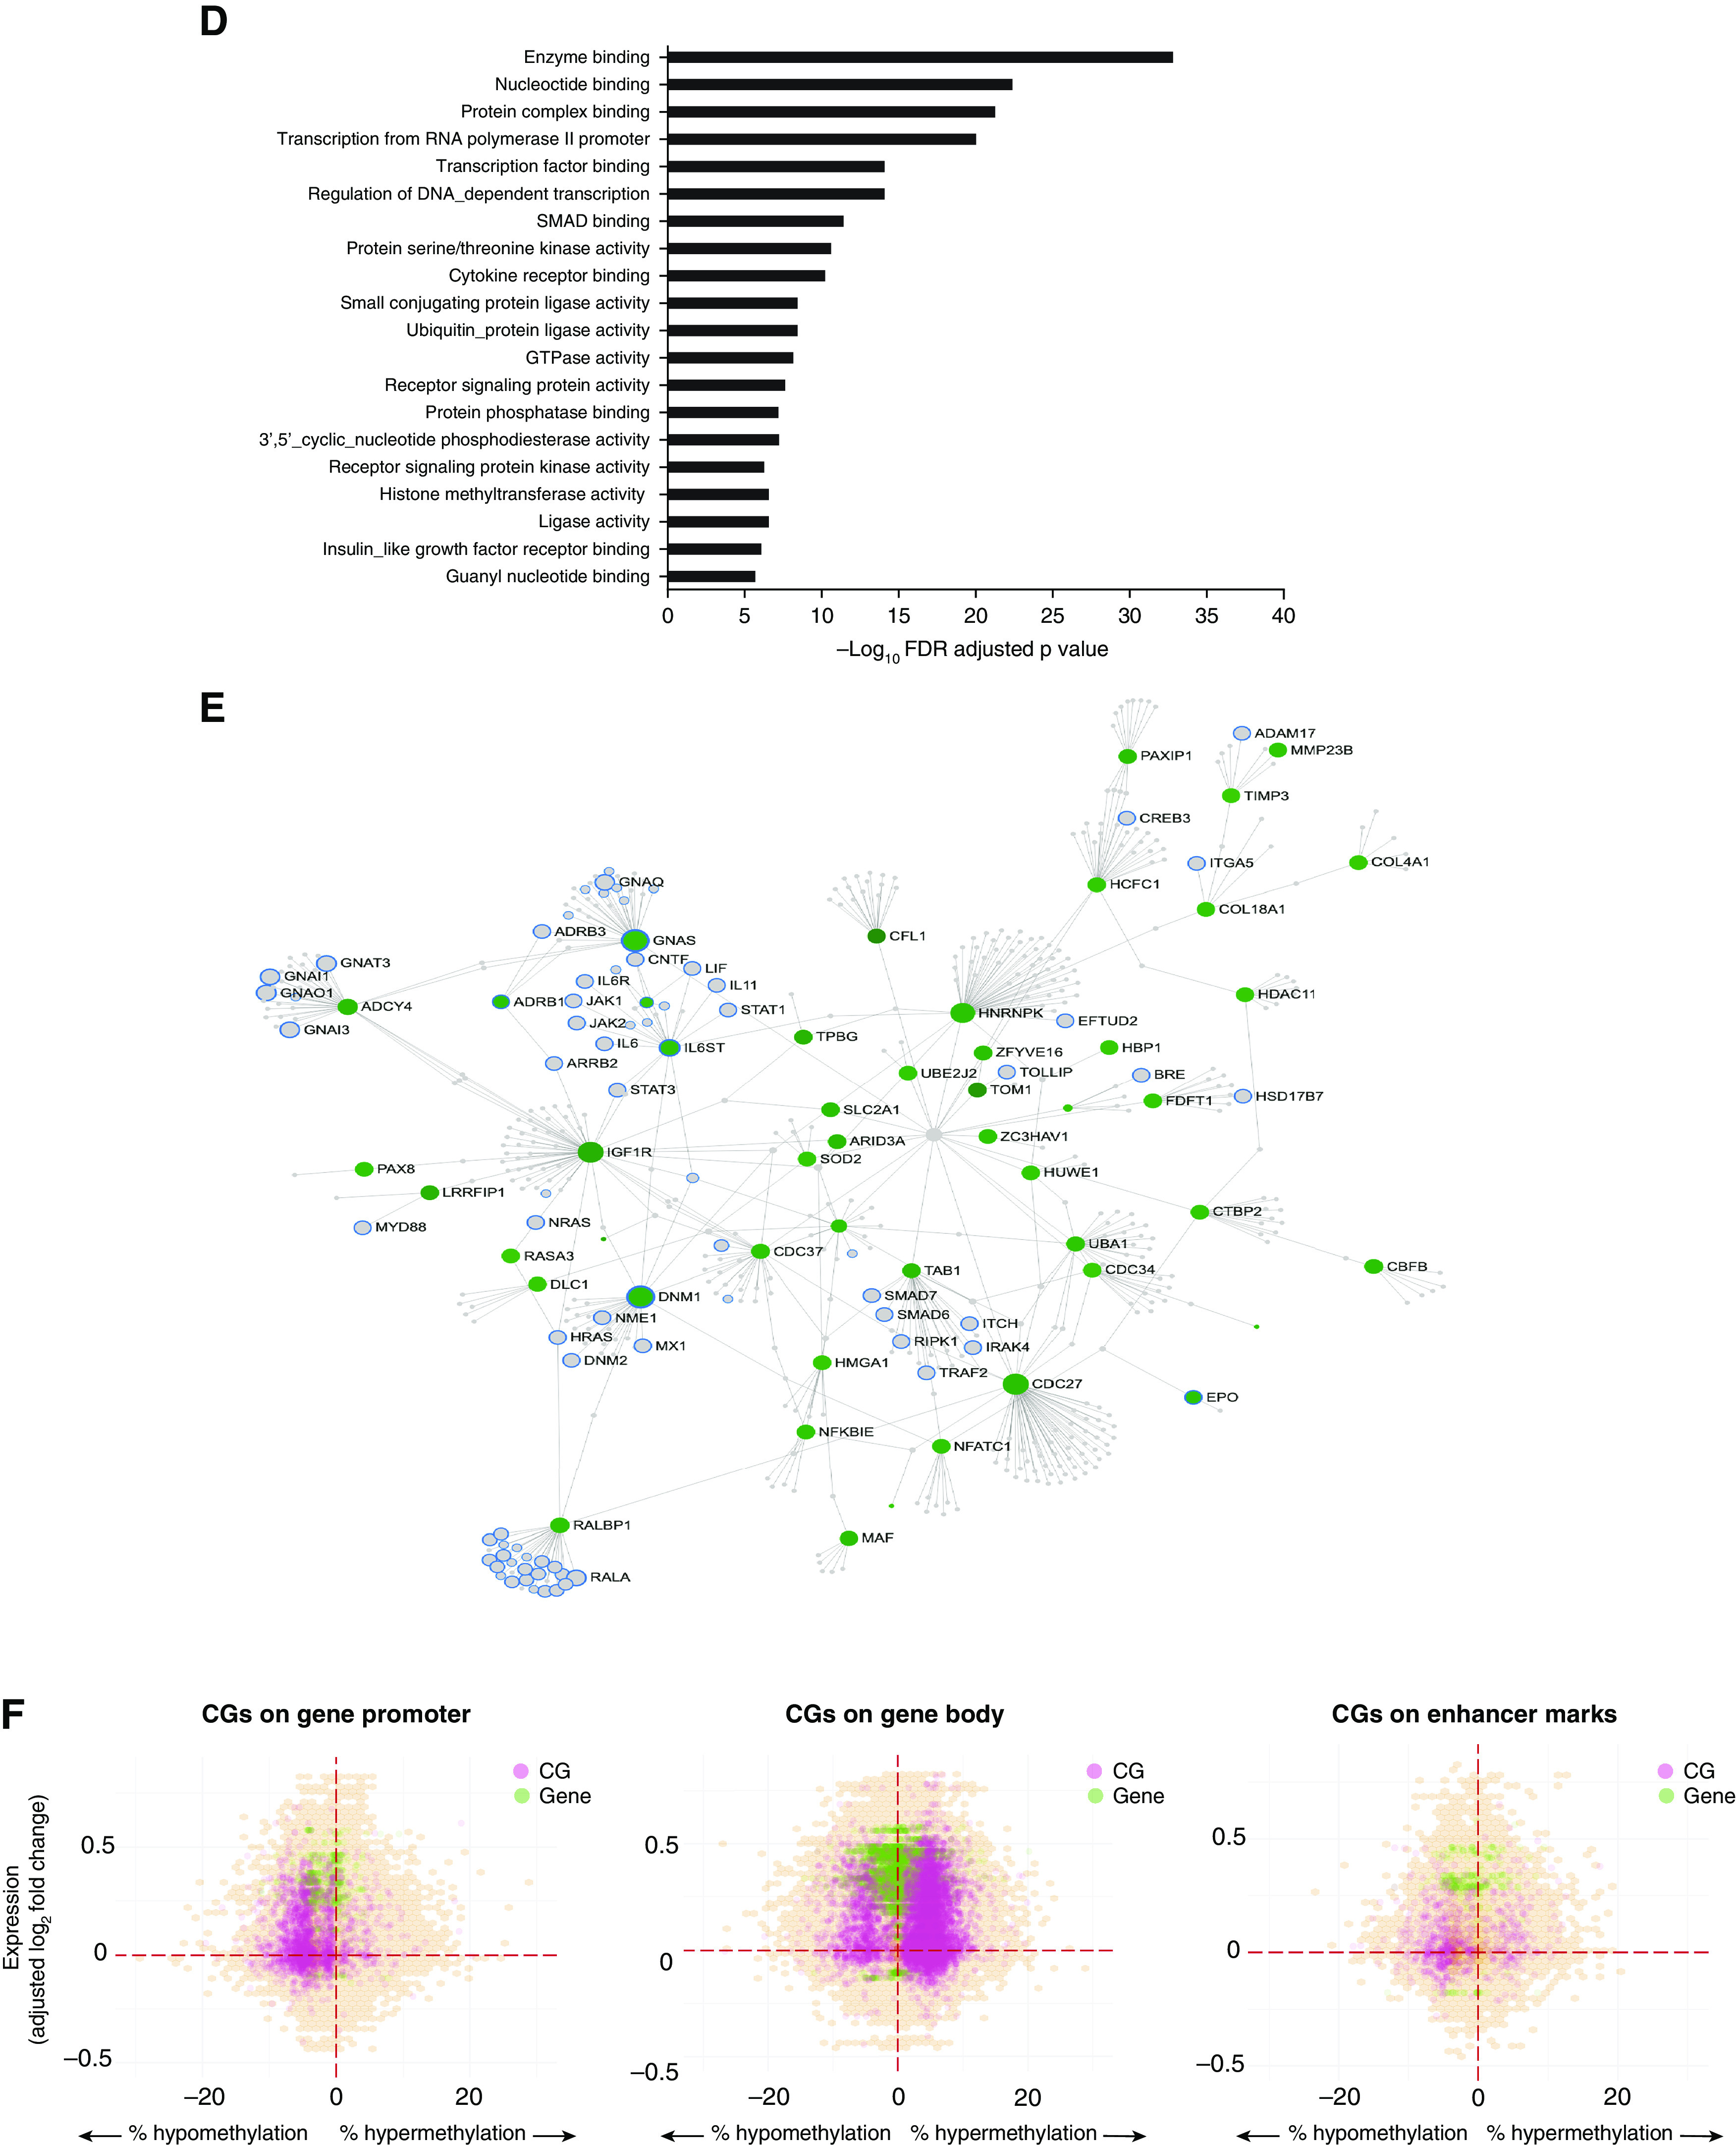
Differential DNA methylation in obese asthma T-helper (Th) cells. (A) DNA methylation variance was also influenced by both technical and biological factors. The heat map summarizes the principal components (PCs) for gene expression variance, with greater than 80% of the variance explained by the first PC. Shades of blue denote the significance of the contribution of each covariate to the PC. Apart from technical factors, proportions of memory and regulatory Th cells (cluster 4) and serum insulin and low-density lipoprotein (LDL) concentrations were significant contributors to variance of the Th-cell methylome. Gene Ontology (GO) pathway analysis revealed that both (B) hypermethylated CGs, marked in red in C, and (D) hypomethylated CGs, marked in green in E, in obese asthma Th cells relative to normal-weight asthma Th cells were enriched for Rho-GTPase/small GTPase pathways; the top 20 GO pathways are included (false discovery rate [FDR]-adjusted P < 0.05). In the networks (C and E), genes in GTPase pathways are marked with blue outline; genes marked in gray were not significantly differentially methylated in obese asthma relative to normal-weight asthma Th cells. (F) The hexagonal plots summarize the association between gene expression and DNA methylation. Statistically significant differentially expressed genes are marked in green, and differentially methylated CGs are marked in pink. Overlapping genes and CGs that did not reach statistical significance are shown in orange, with higher density denoted with darker shades. Both hypo-and hypermethylated CGs were associated with gene upregulation; few CGs were associated with gene downregulation. In keeping with existing literature, more CGs in promoters and enhancers were hypomethylated, and in gene body were hypermethylated, in association with gene upregulation in obese asthma Th cells relative to normal-weight asthma Th cells. GTP = guanosine triphosphate; HDL = high-density lipoprotein; HOMA-IR = homeostatic model assessment of insulin resistance.