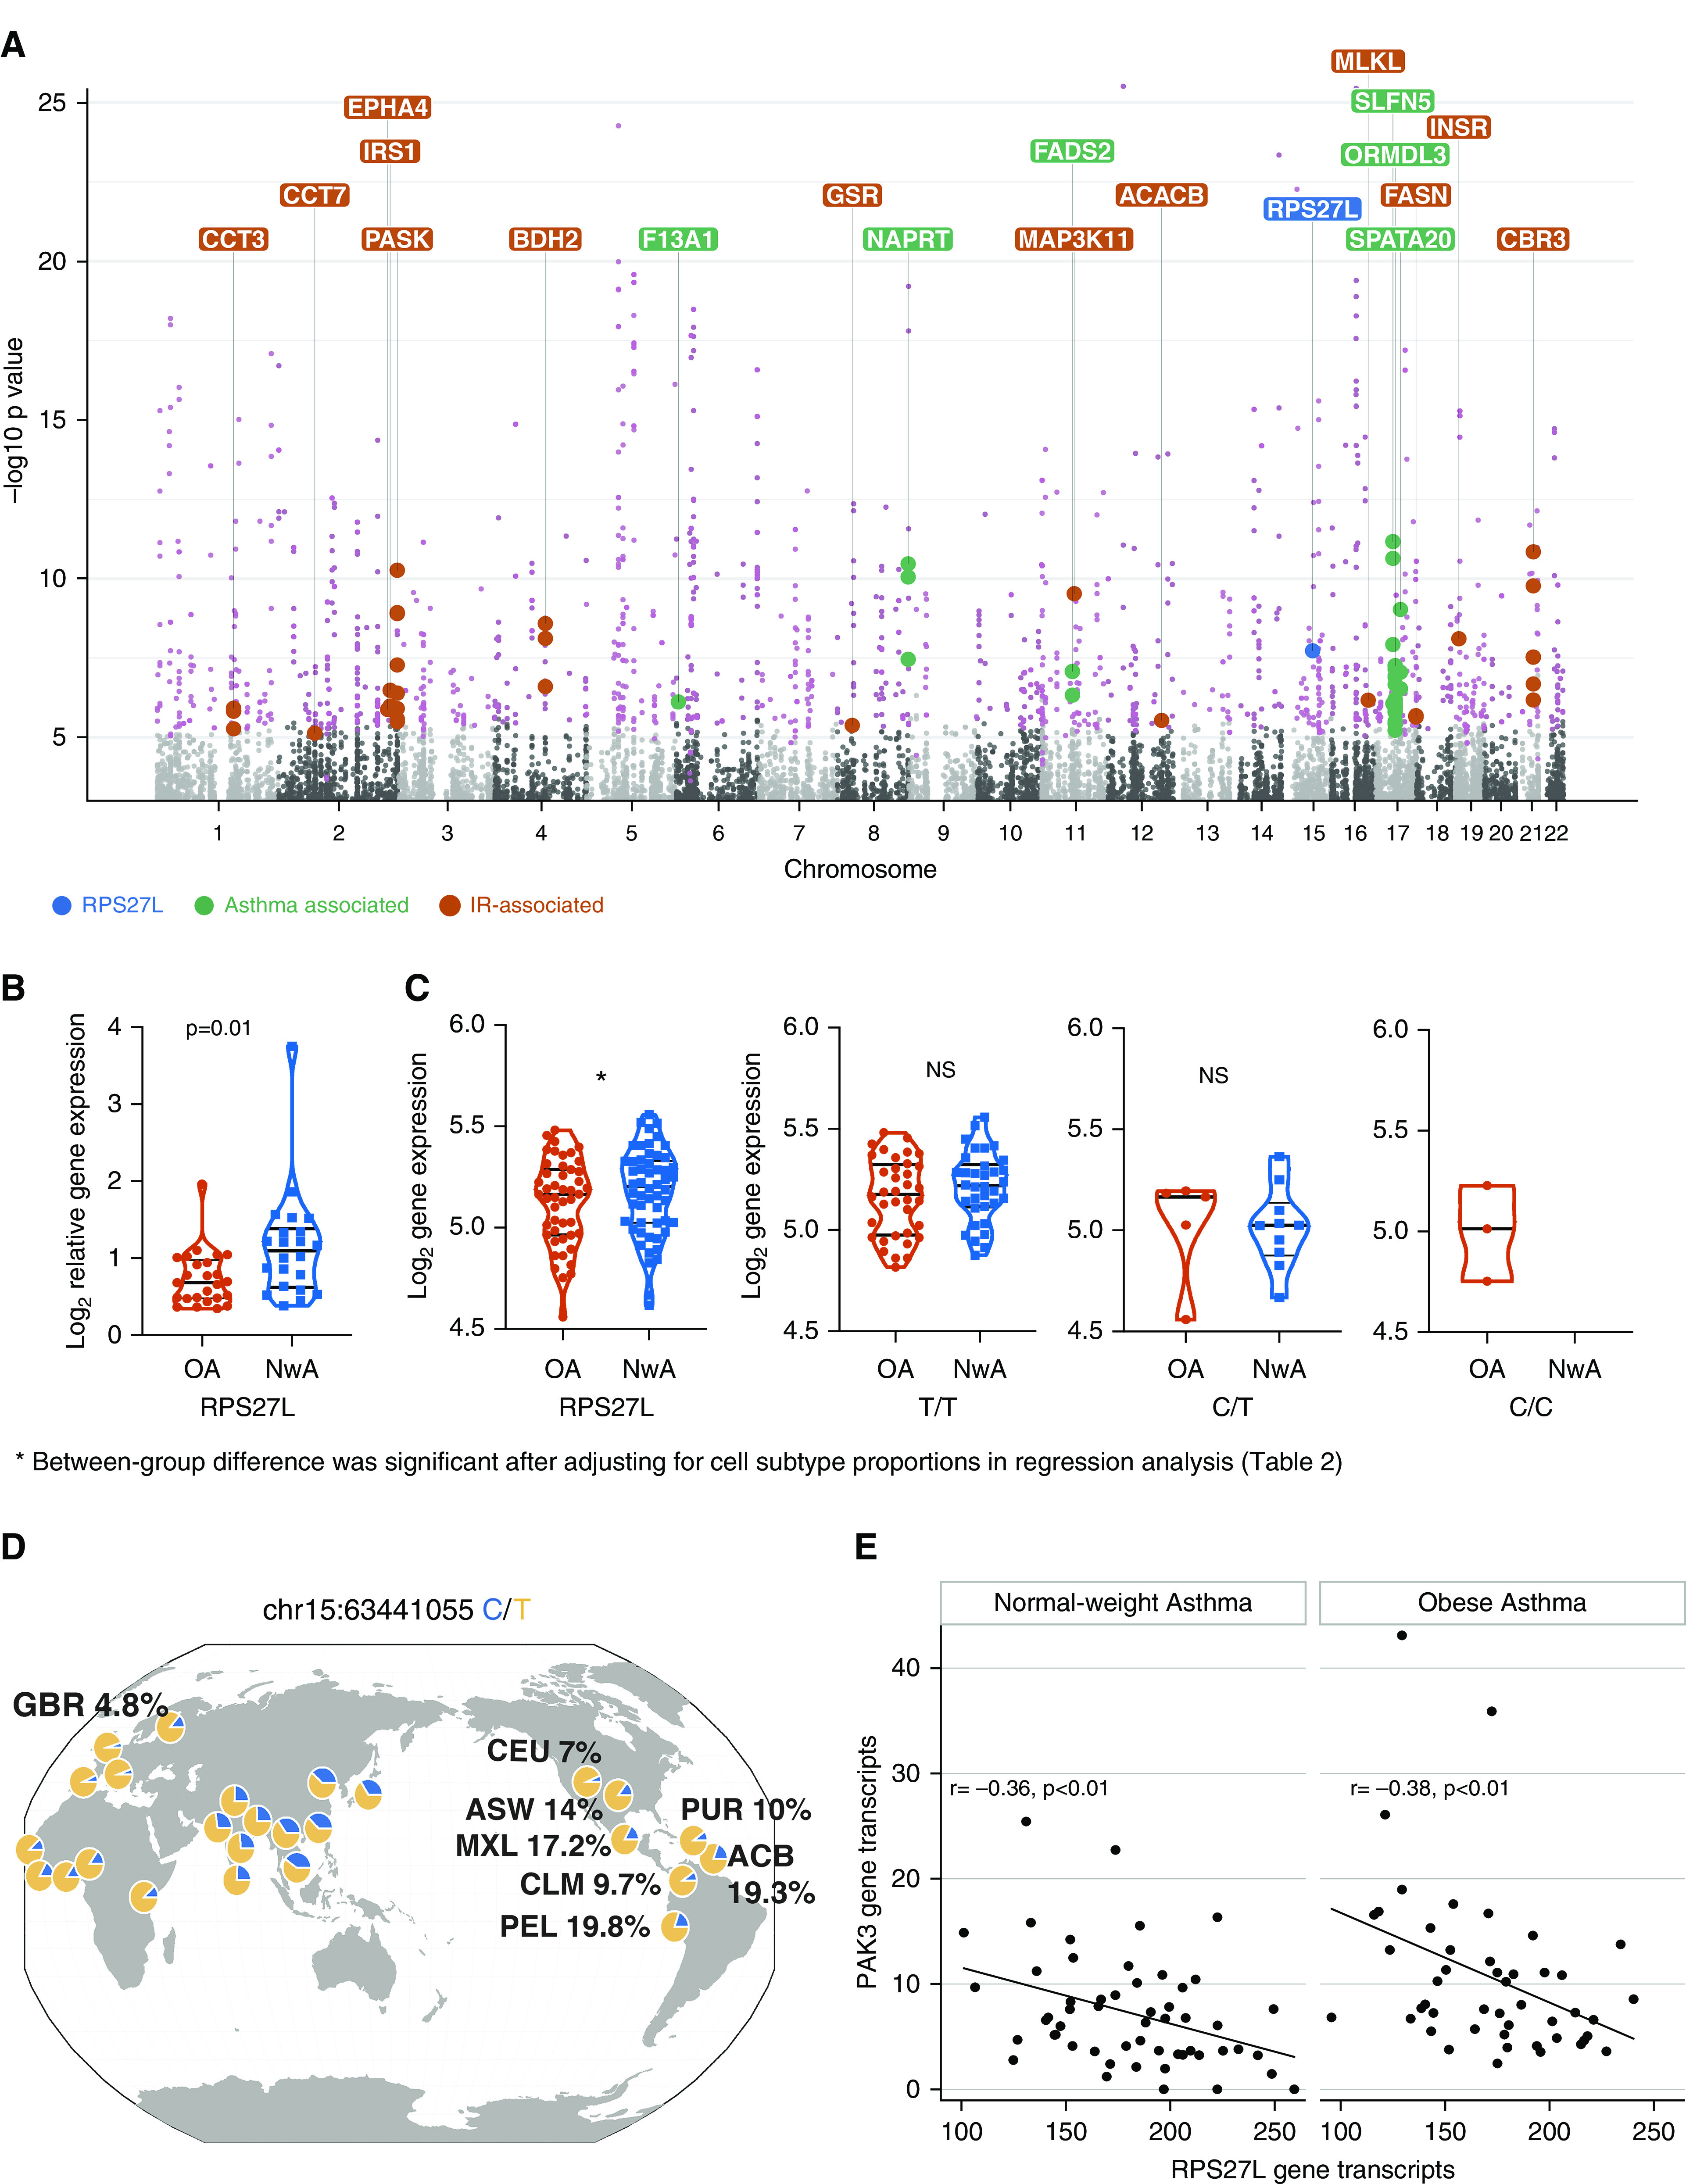
Figure 4.

Contribution of genotype to differential gene expression. (A) Manhattan plot of expression quantitative trait loci analysis, inclusive of obese and normal-weight samples, summarizes the 441 expression quantitative trait loci target genes (e-genes; labeled in pink). Of these, several e-genes (labeled in green) overlapped with genes whose variants have previously been associated with childhood asthma, supporting a role of genetic variance in differential expression in childhood asthma. We also found several e-genes in the insulin metabolism pathway (labeled in orange) that suggest a genetic propensity for altered insulin-mediated T-helper cell metabolism. RPS27L (40S ribosomal protein S27-like; labeled in blue) was the one e-gene that was differentially expressed (downregulated) in obese children with asthma and (B) was verified by quantitative PCR. (C) Gene expression differences in RPS27L were driven by nonuniform distribution of genetic variants between obese asthma (OA) and normal-weight asthma (NwA) samples, with only obese children with asthma and no normal-weight children with asthma being homozygous for the minor allele. (D) The minor allele is enriched in Americans of African ancestry in the southwestern United States (ASW), Afro-Caribbeans in Barbados (ACB), and Latino populations (Mexican ancestry from Los Angeles [MXL], Colombians [CLM], Puerto Ricans [PUR], and Peruvians [PEL]) as compared with Utah residents of northern and western European ancestry (CEU) and British (GBR) (mapped on the Genomics of Genetic Variants Browser; popgen.uchicago.edu/ggv). (E) The number of RPS27L gene transcripts inversely correlated with number of PAK3 (p21 protein-activated kinase 3) gene transcripts. IR = insulin resistance; NS = nonsignificant.
