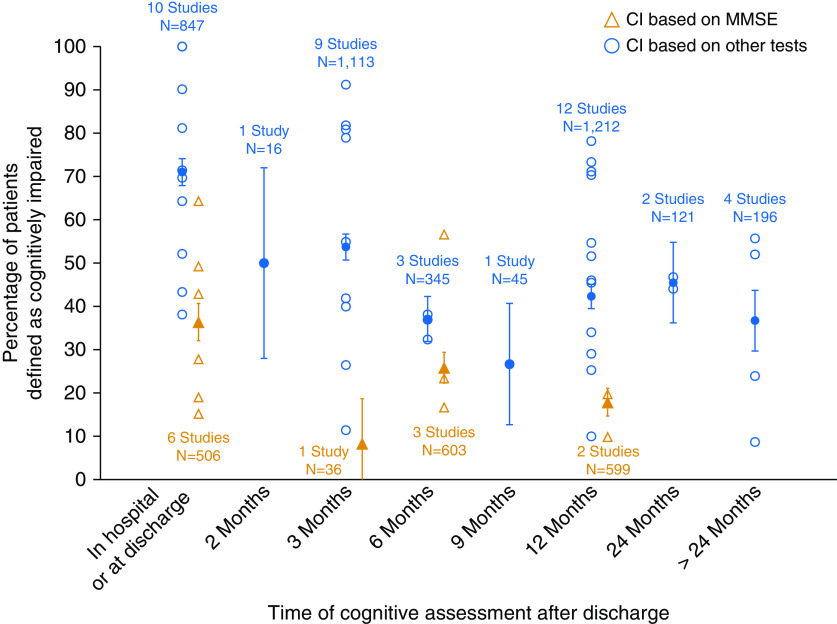
Figure 3.
Frequency of cognitive impairment based on Mini-Mental State Examination (MMSE) only versus other measures. Open symbols represent frequency reported by individual studies. Solid symbols represent the aggregate frequency calculated based on all studies for that time point. Bars represent 95% confidence interval (CI).

