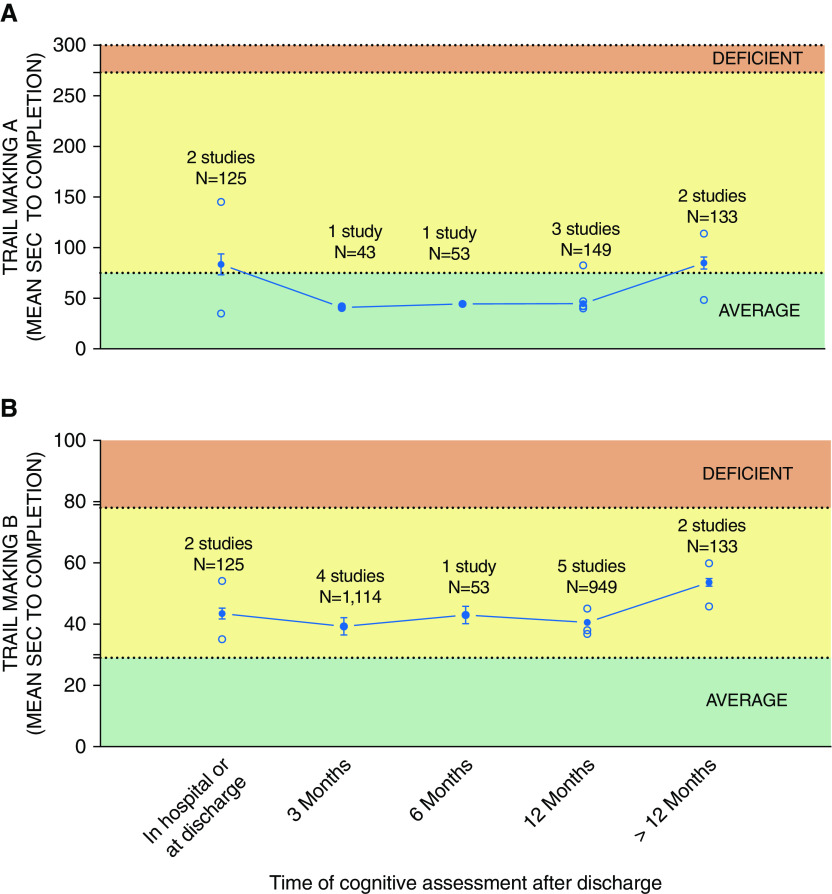
Figure 6.
Aggregate time to test completion for (A) Trail Making Test A and (B) Trail Making Test B. Solid circles represent the weighted average (accounting for sample size) calculated based on all studies for that time point. Line represents trend over time based on the weighted average. Bars represent 95% confidence interval. Note that across multiple time points from ICU discharge, both tests failed to detect cognitive impairment in their respective domains (cognitive processing speed for Test A and executive function for Test B). Open symbols represent frequency reported by individual studies.

