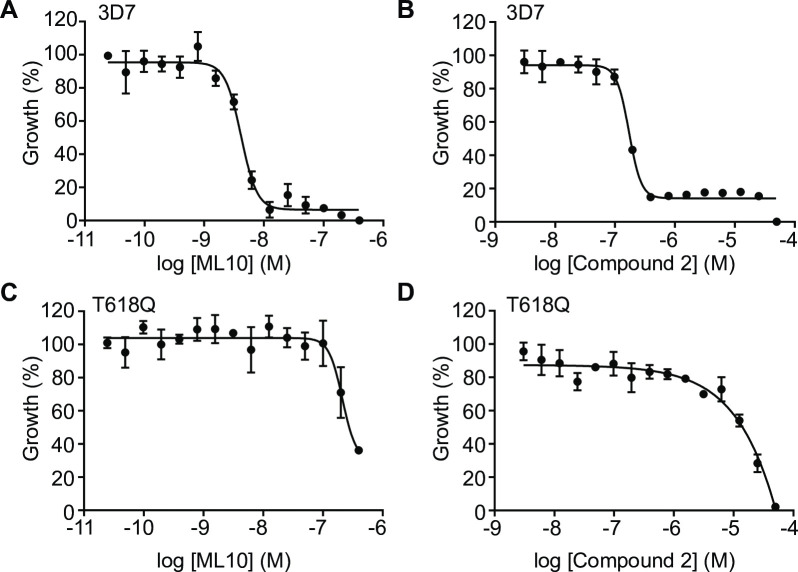
Fig 1. Dose-response curves of ML10 and Compound 2 for P. falciparum 3D7 and T618Q parasites.
P. falciparum 3D7 parasites (A and B) and T618Q parasites that harbor a gatekeeper mutation in the gene encoding PKG (C and D) were cultured in the presence of decreasing concentrations of ML10 (A and C) or Compound 2 (B and D). Parasite growth was determined using a 72-hour SYBR Green I assay and the EC50 value for the compounds was calculated for each strain from the resulting dose-response curve. Shown are representative dose-response curves from one of five independent experiments. For EC50 values of all five experiments, see S1 Fig; for the average EC50 values, see Table 1. For both compounds, the difference between the EC50 for 3D7 and the T618Q parasites was statistically significant by an unpaired t-test, in both cases, p≤0.001.

