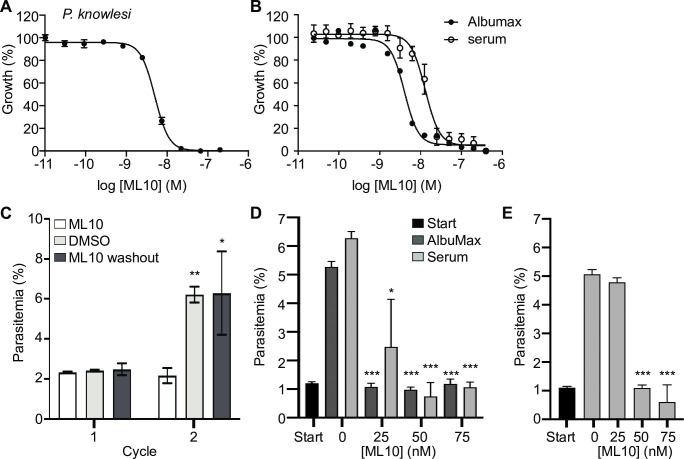
Fig 3. Dose-response curve of P. knowlesi cultured in the presence of ML10 and effect of serum on EC50 of ML10 of P. falciparum.
Dose-response curves derived from parasite growth inhibition assays obtained with P. knowlesi strain A1-H.1 (A) and P. falciparum strain 3D7 cultured in RPMI-1640 with or without supplementation with 10% horse serum (B). These results were used to calculate the EC50 of ML10 on parasites during the erythrocytic stage. (C) Effect of 150 nM ML10 on the growth of P. knowlesi. Late stage synchronized parasites were incubated in the presence of 150 nM ML10 (bars on left-hand and right-hand side) or DMSO (bars in middle). When ring-stage parasites were detected in the untreated sample (approximately two hours after addition of ML10), the parasites were washed to remove the ML10 or DMSO. Parasites were subsequently incubated in the presence of DMSO or ML10. Note that 150 mM ML10 completely blocks progression to the next cycle, whereas removal of the compound after two hours of incubation has no effect on the parasitemia in the next cycle. Results from statistical comparison of the ML10-treated sample with the DMSO and the wash-out sample in each cycle are represented as *p≤0.05, **p≤0.01, whereas no symbol indicates no statistical significance. (D, E) To identify an effective working concentration of ML10 for P. falciparum in the presence of human serum, parasite cultures were cultured in the presence of 0.5% AlbuMax alone or AlbuMax and 5% serum (D) or 10% serum (without additional AlbuMax) (E) and ML10 at concentrations ranging from 0–75 nM for one cycle. Start (black bars) denotes the parasitemia of the culture in the first cycle, prior to the addition of ML10. Error bars denote the standard deviation of three replicates. Results of statistical comparison of 0 nM sample with the samples treated with ML10 is indicated as *p≤0.05 and ***p≤0.001.

