
Figure 4.
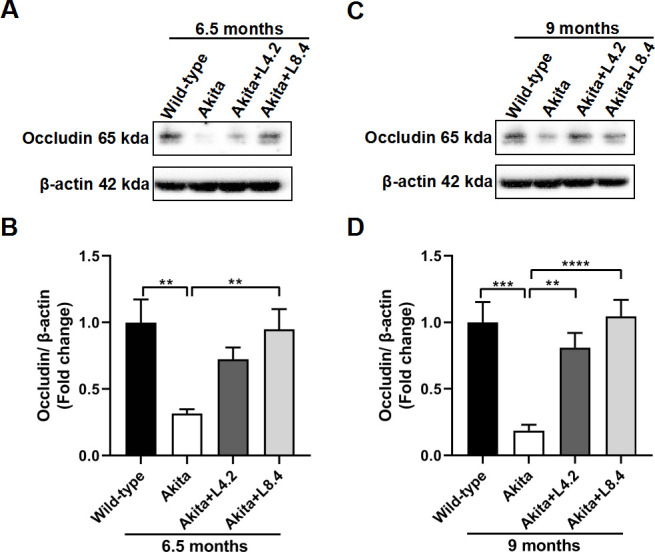
Alleviation of tight junction protein disruption by lutein treatment in the retinas of the Ins2Akita/+ mice. (A, B) Western blot results showing occludin expression levels in the wild-type, untreated Ins2Akita/+, lutein-treated Ins2Akita/+ (4.2 mg/kg/day, Akita+L4.2) and lutein-treated Ins2Akita/+ (8.4 mg/kg/day, Akita+L8.4) mice at 6.5 months of age. (C, D) Western blot results showing occludin expression levels in the four experimental groups at 9 months of age. Occludin expression level in each group was normalized with β-actin. Fold changes relative to wild-type control are shown. n=6–7. Data are presented as mean±SEM. One-way ANOVA followed by Tukey’s multiple comparison test. **P<0.01, ***p<0.001. ****p<0.0001. ANOVA, analysis of variance.