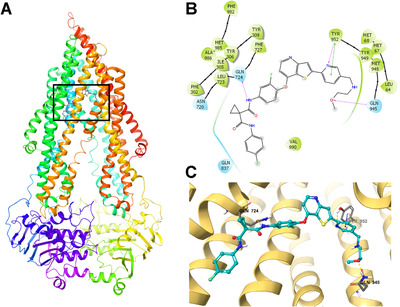
FIGURE 1.

The in silico docking simulation analysis between sitravatinib and human‐mouse chimeric ABCB1 model (PDB ID: 6FN1) using Maestro. A. The overall structure of ABCB1 and the binding site of sitravatinib. B. The 2‐dimension diagram of the binding of sitravatinib with ABCB1. Blue bubbles indicate hydrophilic amino acids, and green bubbles indicate hydrophobic amino acids. Hydrogen bonds are shown with purple arrows, and green short line indicates π‐π interaction. C. The 3‐dimension diagram of the interaction of sitravatinib and ABCB1. Hydrogen bonds are shown with yellow dot lines, and π‐π interaction is indicated with blue dot line. The ABCB1 protein is depicted with yellow ribbon. Sitravatinib is shown with the following color codes: carbon (cyan), oxygen (red), nitrogen (blue), sulfur (yellow), fluoride (green), hydrogen (white). Abbreviations: ABCB1, ATP‐binding cassette subfamily B member 1
