
FIGURE 2.
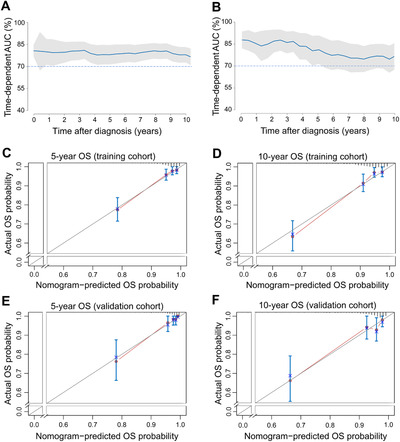
Time‐dependent AUC and calibration curves of the nomogram. (A‐B) Time‐dependent AUC of using the nomogram to predict overall survival probability within 10 years in the training cohort and validation cohorts. The 95% confidence interval was calculated by using the bootstrapping cross‐validation method. The blue line represents AUC = 0.7, which is considered ideal. (C‐D) Calibration curves of 5‐year and 10‐year OS for LG‐ESS patients in the training cohort. (E‐F) Calibration curves of 5‐year and 10‐year OS for LG‐ESS patients in the validation cohort. The light blue line indicates the ideal reference line where predicted probabilities would match the observed survival rates. The red dots are calculated by bootstrapping (resample: 1000) and represent the performance of the nomogram. The closer the solid red line is to the light blue line, the more accurately the model predicts survival. AUC: area under the time‐dependent receiver operating characteristic curves; OS: overall survival; LG‐ESS: low‐grade endometrial stromal sarcoma