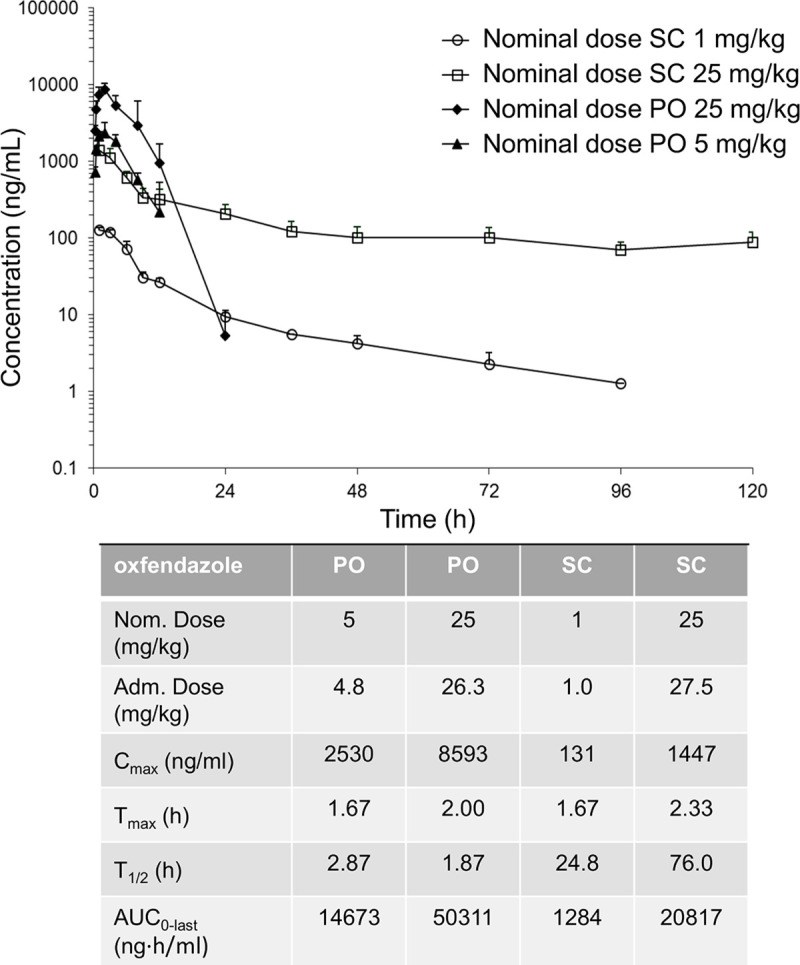
Fig 3. Pharmacokinetic profile of oxfendazole in mice following oral and subcutaneous administration.

Maximum plasma concentrations (Cmax), time to Cmax (Tmax), half-life (T1/2) and area under the curve at the last measured plasma concentration (AUC0-last) of oxfendazole in mice after oral (PO) or subcutaneous (SC) administration (n = 3 per group) at the indicated doses.
