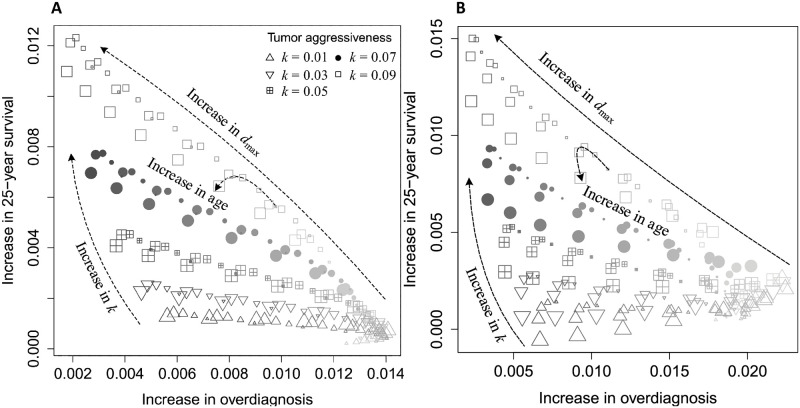
Fig 7. Benefit (increase in probability of surviving patients after 25 years of follow-up) and harm (increase in probability of patients diagnosed with cancers that would not have been the cause of death) of mammography screening.
Size of dots indicates age, the size increases with age. Color saturation increases with value of dmax. Markers indicate value of k, triangle (square) corresponds to the smallest (largest) value of k. A) The baseline case, and B) the high risk case with an increase of breast cancer incidence by a factor of 5 in comparison with the baseline case presented.

