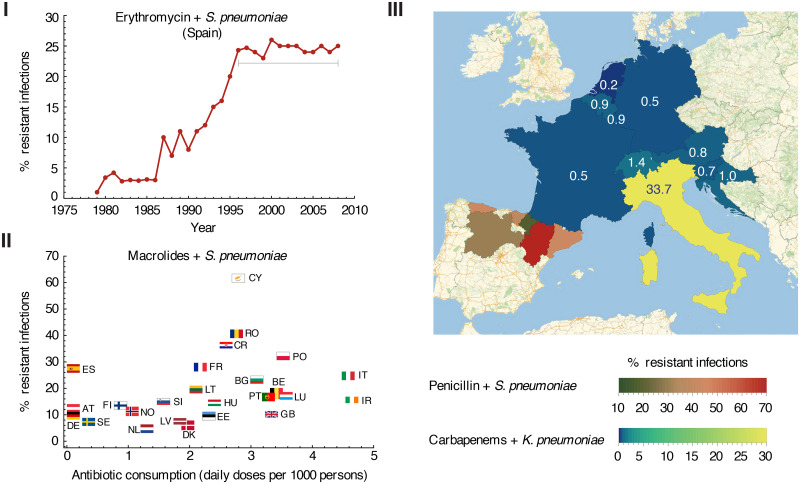
Fig 1. A selection of data illustrating spatiotemporal patterns of antibiotic resistance that common mathematical models have difficulty explaining.
I) Percentage of S. pneumoniae isolates in Spain which are resistant to erythromycin (a macrolide), over time. After an initial increase, drug-sensitive and drug-resistant strains have appeared to coexist stably for ∼ 15 years. [12]. II) The same amount of antibiotic use can lead to very different levels of resistance in different regions. Percentage of S. pneumoniae isolates from 2016 that were resistant to macrolides versus the number of daily doses of macrolides administered per capita, for each country participating in the European Centres for Disease Prevention and Control [13–16]. III) Neighboring regions can have vastly different rates of resistance which persist for long time periods. Time-averaged percent of K. pneumoniae isolates resistant to carbapenems in Austria, Belgium, Croatia, France, Germany, Italy, Luxembourg, and Slovenia from 2013-2016 and Switzerland from 2015-2016 [14, 17] (blue/yellow), along with S. pneumoniae isolates resistant to penicillin in six provinces of Spain from 1990-1998 (green/red) [18, 19]. The year-to-year deviation from this average is less than 3% (see S1 Fig). Each country is labeled with the resistance level (%). Note that for S. pneumoniae and macrolides or penicillin, “% resistant” includes isolates classified as “non-susceptible”.

